TRON bulls run into opposition just beneath $0.08 as…

Disclaimer: The information presented does not constitute financial, investment, trading, or other types of advice and is solely the writer’s opinion.
- The TRON market structure was bearish but could soon see a shift in favor of the buyers.
- Although the momentum was bullish, buying pressure was not strong.
TRON [TRX] has registered impressive gains of 13% in the past two weeks. Bitcoin [BTC] posted gains of 16% at the same time, making the achievement of TRX a little less impressive. Moreover, TRX was not in a higher timeframe uptrend either.
Read TRON’s [TRX] Price Prediction 2023-24
While the lower timeframes showed a strong bullish bias, the daily chart was not as convincing. The uptrend TRON was on since March was halted in early June. The $0.08 resistance zone was vital for the bulls to flip to support before the uptrend can resume.
The $0.08 resistance is of vital importance to TRX bulls
![TRON [TRX] bulls run into opposition just beneath $0.08- what next?](https://statics.ambcrypto.com/wp-content/uploads/2023/07/PP-1-TRX-price.png)
Source: TRX/USDT on TradingView
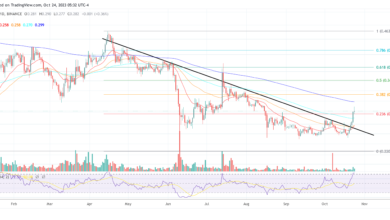
The two recent highs on the daily chart are marked in orange. The $0.0784 level was just above a bearish order block at $0.0768 where the prices consolidated on 8 June before resuming their downward move.
The TRX bounce from the $0.0695 level that occurred in the past two weeks was accompanied by a rise in buying pressure. This was reflected in the slowly rising OBV. Meanwhile, the RSI also indicated bullish momentum with a reading of 64.
Yet, the market structure of TRX remained bearish on the daily chart. The price must be driven above the recent high at $0.0784 to shift the structure bullishly. Just past it, the $0.799 level represented the high from 23 May, when TRON bulls faced a temporary rejection on the chart.
The Open Interest began to climb higher but remained faint
![TRON [TRX] bulls run into opposition just beneath $0.08- what next?](https://statics.ambcrypto.com/wp-content/uploads/2023/07/PP-1-TRX-santiment.png)
Source: Coinglass
The price charts highlighted just how important the $0.08 zone was. TRON saw an uptrend since March but this was interrupted in June. The bulls must breach the $0.08 and $0.0855 levels to resume the uptrend.
How much are 1, 10, or 100 TRX worth today?
The Coinglass chart above showed that TRX saw a huge surge in OI after 20 May. The price ascended past the $0.072 resistance back then. This level had served as resistance back in February and was previously tested as resistance in July 2022.
Hence, the move past $0.072 was of immense significance. Similarly, the $0.084-$0.086 has been resistance since May 2022. The daily chart showed little resistance between $0.08 and $0.085- but can bulls bridge this gap?


