beginner
Are you looking to start your trading journey, or enhance your trading strategy? If so, you will need to learn how to spot crypto chart patterns.
In this article, we will discuss some of the most common chart patterns that traders use to make decisions. We will also provide examples of each pattern. So, if you’re ready to learn about crypto chart patterns, keep reading!
What Are Chart Patterns?
Chart patterns and trend lines are used in technical analysis to help identify potential trading opportunities. Traders use them to recognize turning points and strong reversals that could indicate buying or selling opportunities in the market.
Trading patterns come in many shapes and sizes. Being common formations that occur on a price chart, they can signal to traders that a certain price action may take place. These patterns can help predict future price movements.
Trend lines are a key component of technical analysis. They are used to identify areas of support and resistance, indicate a prevailing market trend, forecast potential price targets, and filter out noise prices. Trend lines can be drawn using data points such as highs or lows on the chart. While drawing one, it’s also crucial to track moving averages, identify particular market conditions, and study the slope of the trend line. These trend lines help traders identify entry/exit points in their trades as well as adjust their positions based on future market movements. Ultimately, they give traders better chances at spotting profitable trading opportunities in the markets.
Triangle Crypto Chart Patterns
One of the most common chart patterns is the triangle. There are three types of triangles:
- Ascending
- Descending
- Symmetrical

Ascending and descending triangles are continuation chart patterns, which means that they typically occur in the middle of a trend and signal that the trend will continue. Symmetrical triangles are considered to be reversal patterns, which means they can occur at the end of a trend and signal that the price may reverse its course.
Triangles are some of the long-lasting patterns: they can take several months or even years to form.
Ascending Triangle
An ascending triangle pattern is created when the price of an asset forms higher highs and higher lows. This pattern signals that the price is likely to continue to rise — so it gives a buy signal.
Here are some common defining characteristics of an ascending triangle:
- The price is forming higher highs and higher lows.
- There is horizontal resistance at a certain price level.
- The chart pattern is typically found in the middle of an uptrend.
Descending Triangle
A descending triangle is a bearish continuation pattern that, just like the name suggests, is the opposite of the ascending triangle. It occurs when the asset price forms lower highs and lower lows. A descending triangle usually gives a sell signal as it is a sign that a bearish trend will probably continue.
There are several ways to identify a descending triangle. These are some of the things you can look for.
- The asset price forms lower highs and lower lows.
- You can observe horizontal support.
- It is the middle of a downtrend.
Symmetrical Triangle
A symmetrical triangle chart pattern emerges when the price of an asset forms higher lows and lower highs. This chart pattern can be found at the end of a trend; it signals that the price may reverse its course. The symmetrical triangle pattern can be either bullish or bearish.
Here are some signs that the pattern you’re seeing might be a symmetrical triangle:
- The price forms higher lows and lower highs.
- There is no clear trend.
- It is the end of a trend.
Rising Wedge Crypto Graph Patterns
Wedges are another subtype of triangle chart patterns. A rising wedge is a bearish reversal pattern that comes to life when the price of an asset forms lower highs and higher lows. This pattern signals that the price is likely to continue to fall. It gives a sell signal.
Here are some things that can point towards a pattern being a rising wedge:
- The price forms lower highs and higher lows.
- There is horizontal resistance at a certain price level.
- It is the middle of a downtrend.
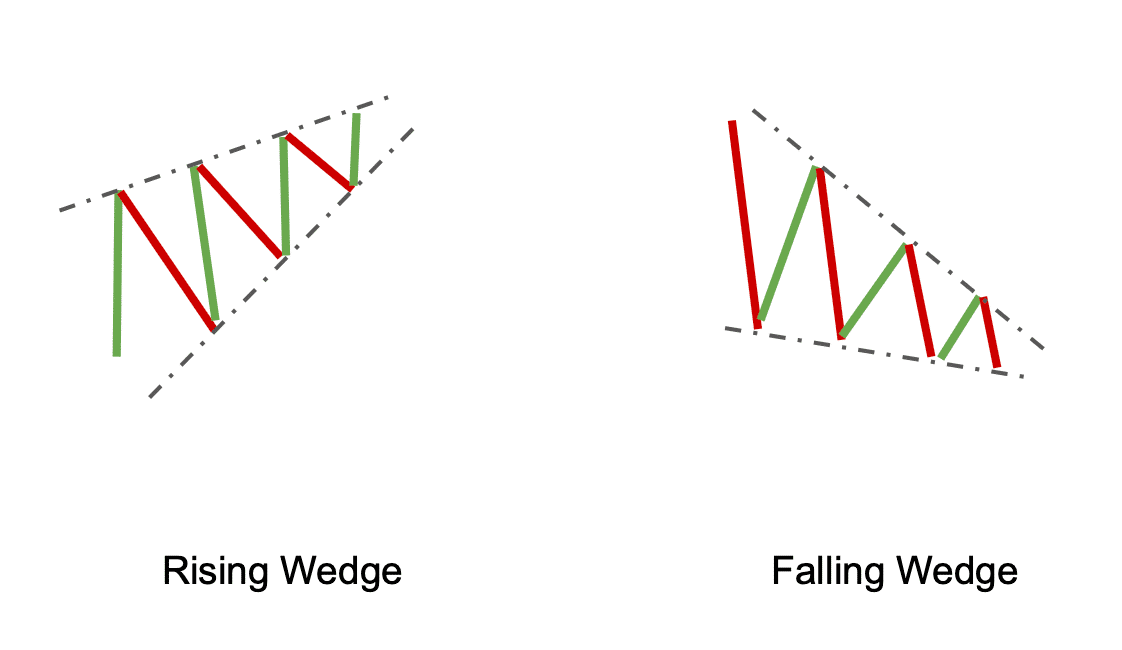
Falling Wedge
A falling wedge is a bullish reversal pattern that, just like the name suggests, is the opposite of the rising wedge. It occurs when there are higher highs and lower lows on the price chart. A falling wedge usually gives a buy signal as it is a sign that an uptrend will probably continue.
There are several ways to identify a falling wedge. These are some of the things you can look for:
- The asset forms higher highs and lower lows.
- You can observe horizontal support.
- It is the middle of an uptrend.
Rectangle Chart Patterns
A rectangle chart pattern is created when the price of an asset consolidates between two horizontal levels of support and resistance. This chart pattern can signal that the price is about to break out in either direction.
Bullish Rectangle
A bullish rectangle is a chart pattern that is created when the price of an asset cannot break out through either the top or the bottom horizontal line and ends up consolidating between the support and resistance levels. This chart pattern signals that the price is likely to break out to the upside — so it gives a buy signal.
Here are the defining characteristics of a bullish rectangle:
- Price consolidation between two horizontal levels of support and resistance.
- This chart pattern is typically found at the end of a downtrend.

Bearish Rectangle
A bearish rectangle is the opposite of the bullish rectangle. It happens when asset price “gets stuck” in between two horizontal levels of support and resistance. A bearish rectangle usually gives a sell signal as it is a sign that the price is likely to continue to fall.
Double Top Crypto Pattern
A double top is one of the most common crypto chart patterns. It is characterized by the price shooting up twice in a short period of time — retesting a new high. If it fails to go back to that level and cross over the upper horizontal line, it typically signifies that a strong pullback is coming. This is a bearish reversal pattern that gives a sell signal.
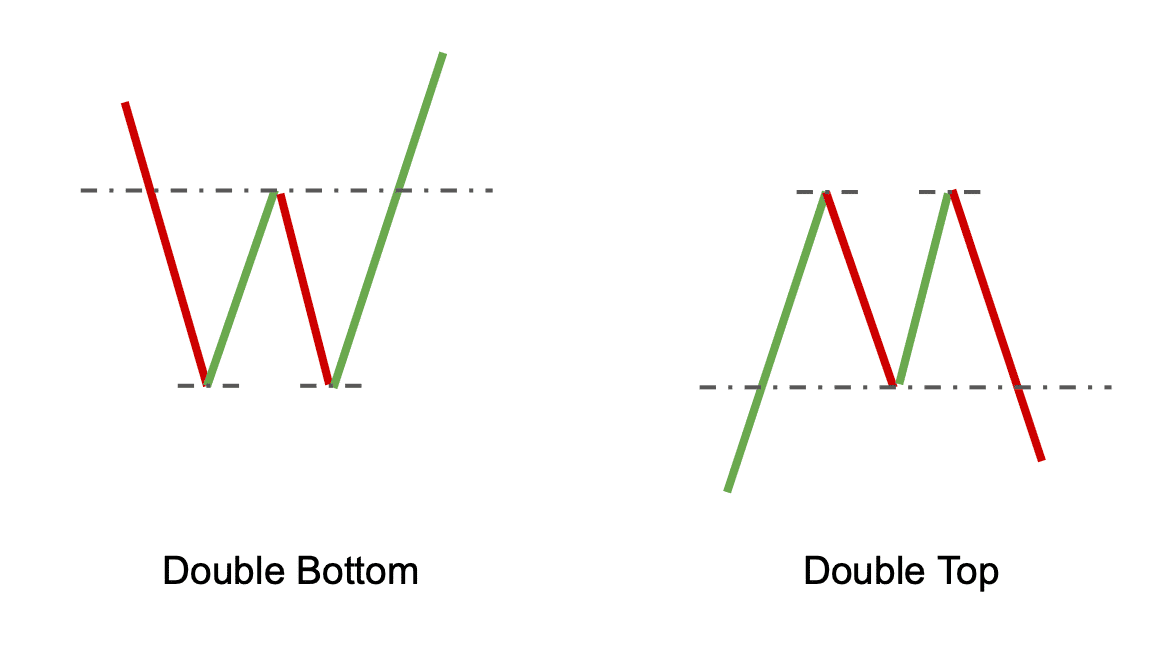
Double Bottom Crypto Pattern
A double bottom is a chart pattern that, as can be seen from its name, is the opposite of the double top. It occurs when the asset price tests the lower horizontal level twice but then pulls back and goes up instead. A double bottom usually gives a buy signal as it is a sign that there will likely be an uptrend.
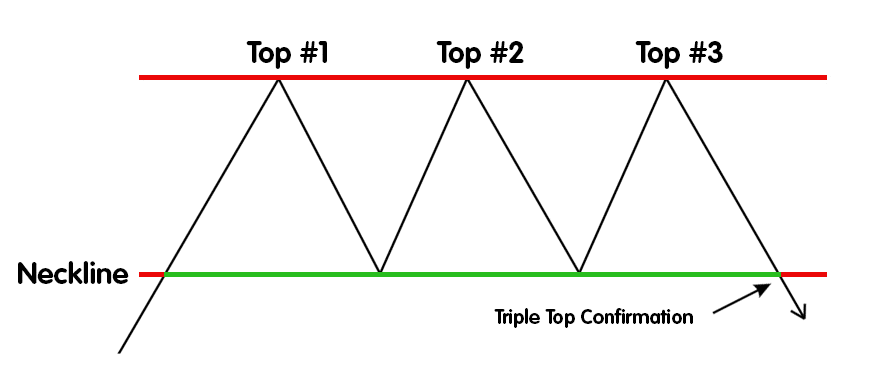
Triple Top
The triple top and bottom patterns are very similar to their “double” counterparts. The triple top also occurs when the price of an asset tests the upper horizontal line but fails to cross over it — but for this pattern, it happens thrice. It is a bearish reversal pattern that signals an upcoming downward trend.
Triple Bottom
The triple bottom crypto chart pattern is observed when asset price reaches a certain level and then pulls back two times before finally kicking off a bullish trend.
Pole Chart Patterns
Pole chart patterns are characterized by the price of an asset reaching a certain level and then pulling back before returning to that level. These patterns get their name from the “pole” present in them — a rapid upward (or downward) price movement.
Bullish Flag Pattern
A bullish flag is a chart pattern that occurs when the asset price reaches a certain level and then pulls back before reclaiming that level. A bullish version of this crypto flag pattern usually gives a buy signal as it is a sign that an uptrend will probably continue. You can read more about it here.
The most distinctive thing about this pattern is, unsurprisingly, its shape: a pole followed by a flag. Here’s how it’s structured:
- Drastic upward price movement
- A brief consolidation period with lower highs
- A bullish trend
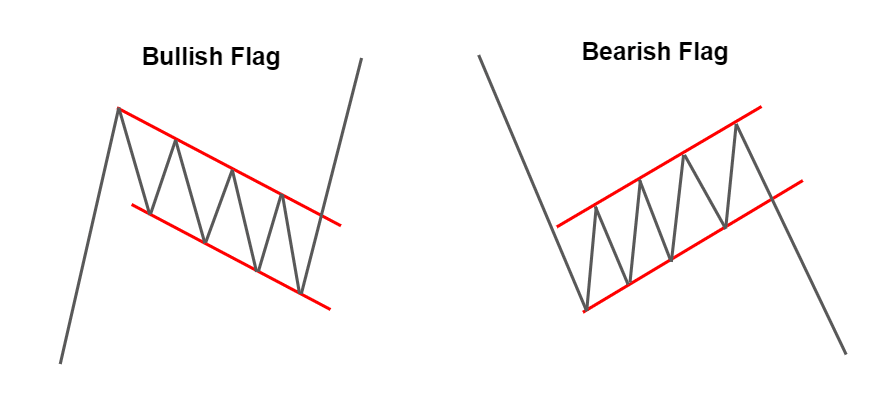
Bearish Flag
A bearish flag is the complete opposite of a bullish flag crypto chart pattern. It is formed by a sharp downtrend and consolidation with higher highs that ends when the price breaks and drops down. These flags are bearish continuation patterns, so they give a sell signal. You can learn more about them in this article.
Bullish Pennant
A bullish pennant is a bullish pole chart pattern rather similar to a bullish flag. It also has a pole — a shart uptrend — followed by a brief (or not so brief) consolidation, and then a continued uptrend. Unlike the flag, however, its consolidation period is shaped like a triangle: it has higher lows and lower highs. It gives a buy signal.
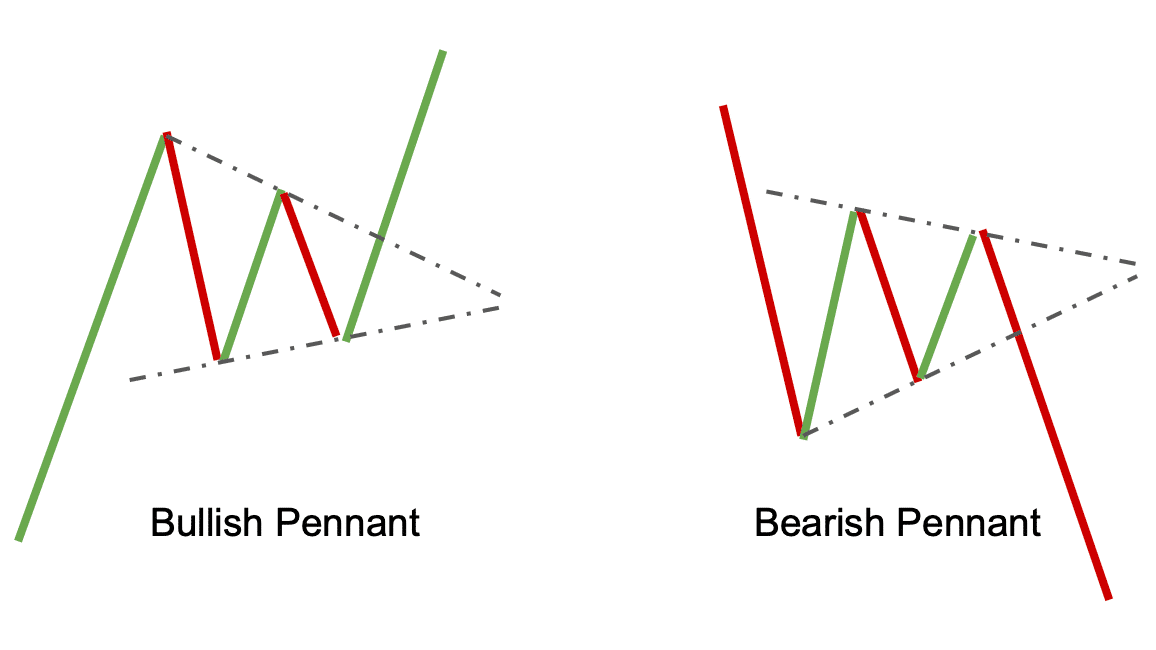
Bearish Pennant
A bearish pennant is, naturally, the opposite of a bullish pendant. Its pole is a sharp downward price movement, and it is followed by a price decrease. It gives a sell signal.
Pennants are also defined by trading volume: it should be exceptionally high during the “pole” and then slowly whittle down during consolidation. They usually last between one and four weeks.
Other Chart Trading Patterns
There are also several other chart patterns that you can look for when trading cryptocurrencies. Here are a few of the most common ones.
Head and Shoulders Crypto Graph Patterns
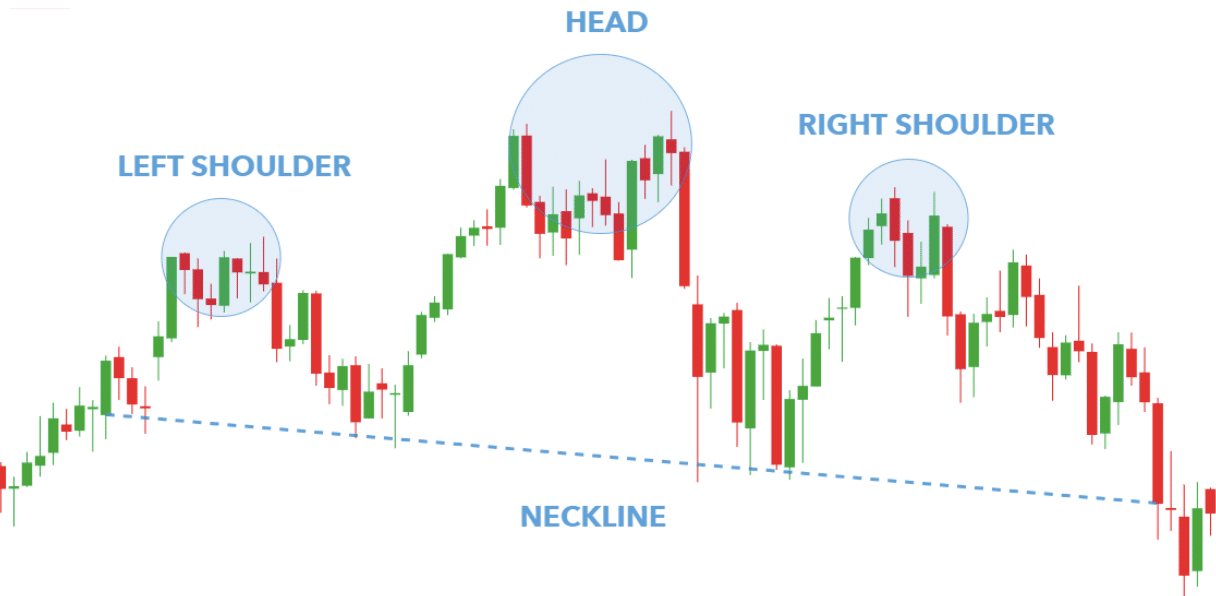
Chart analysis is one of the best tools in trading crypto. Here’s how to identify a head and shoulders pattern.
A more advanced chart pattern, the head and shoulders chart pattern, occurs when the price of an asset reaches a certain level and then pulls back before retaking that level. This chart pattern can be either bullish or bearish, depending on where it occurs in the market cycle.
Inverted Head and Shoulders
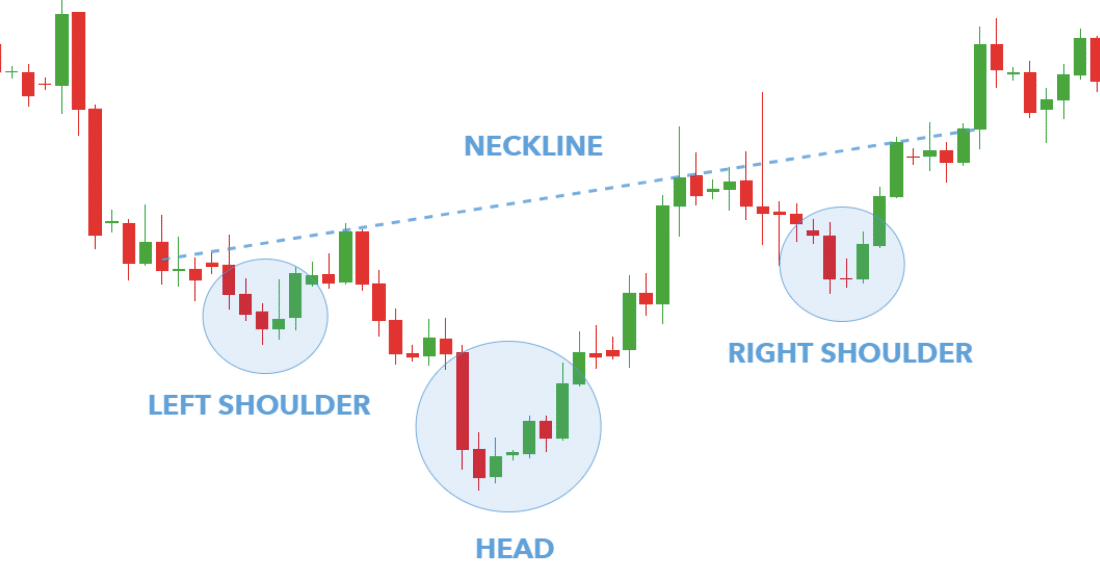
One of the more advanced technical analysis patterns, inverted head and shoulders, should be used with other indicators before taking a position.
The inverted head and shoulders chart pattern is created when the price of an asset reaches a certain level and then pulls back before reaching that level again. This chart pattern is usually bullish and gives a buy signal as it is a sign that an uptrend will probably continue. Just like the name suggests, it is the inverted version of the traditional head and shoulders pattern.
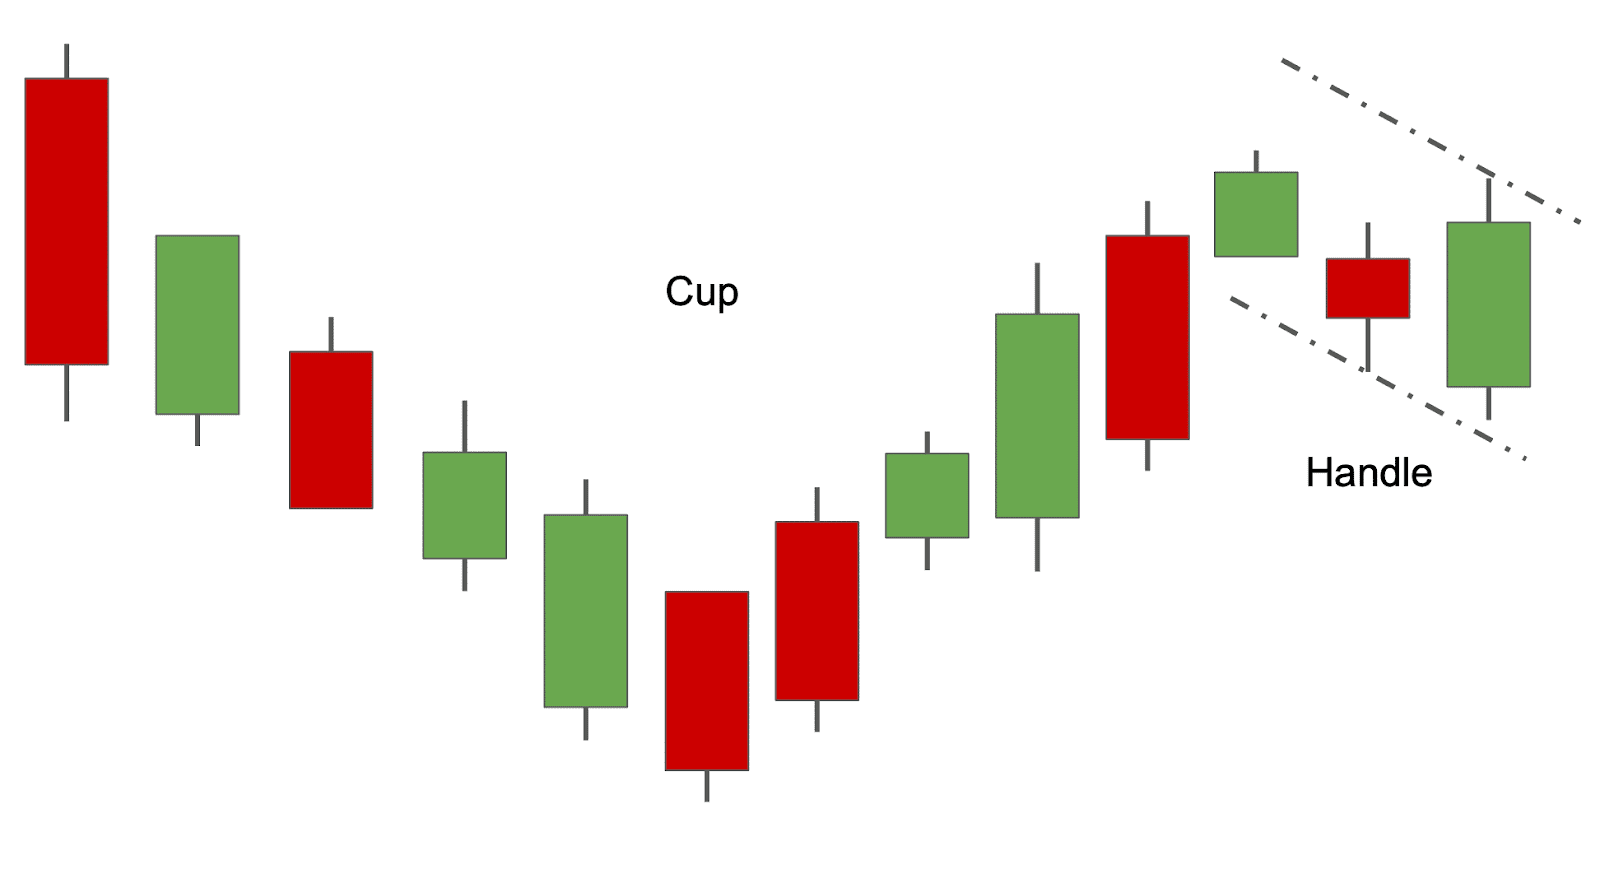
Cup and Handle
The cup and handle is a pattern that can be observed when the price of an asset reaches a certain level and then pulls back before reclaiming that level. It is named like that because it actually looks like a cup.
This chart formation is often referred to as the bullish reversal pattern. However, it can give either a bullish or a bearish signal — it all depends on what point of the cycle it is seen in.
Rounded Top and Bottom Crypto Chart Pattern
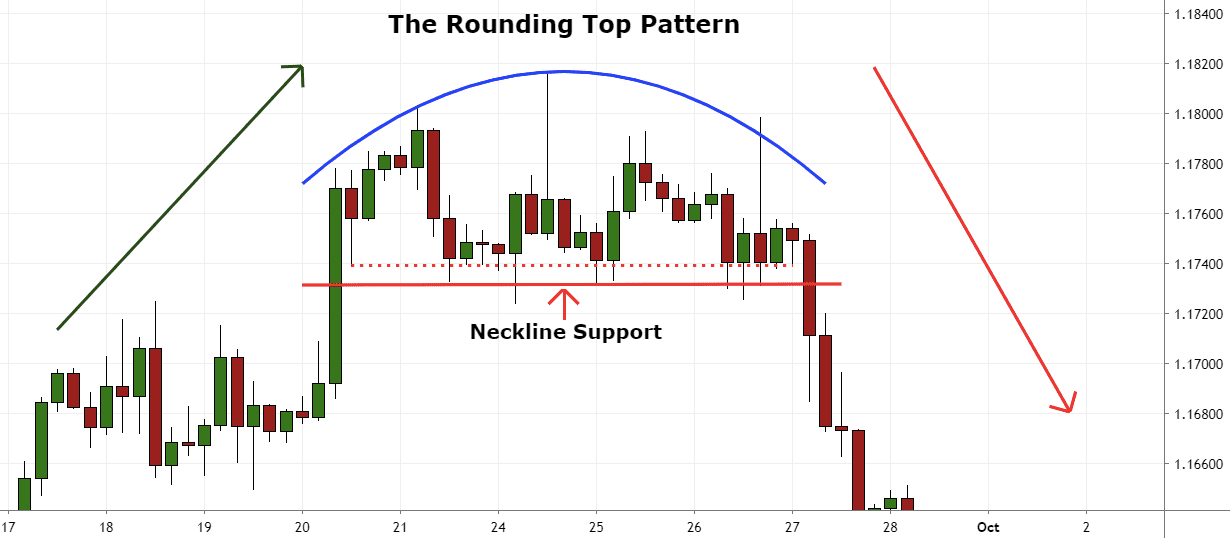
The rounded top and bottom chart pattern appears when the price of an asset reaches a certain level and then pulls back before retaking that level. This chart pattern can be either bullish or bearish, depending on where it occurs in the market cycle.
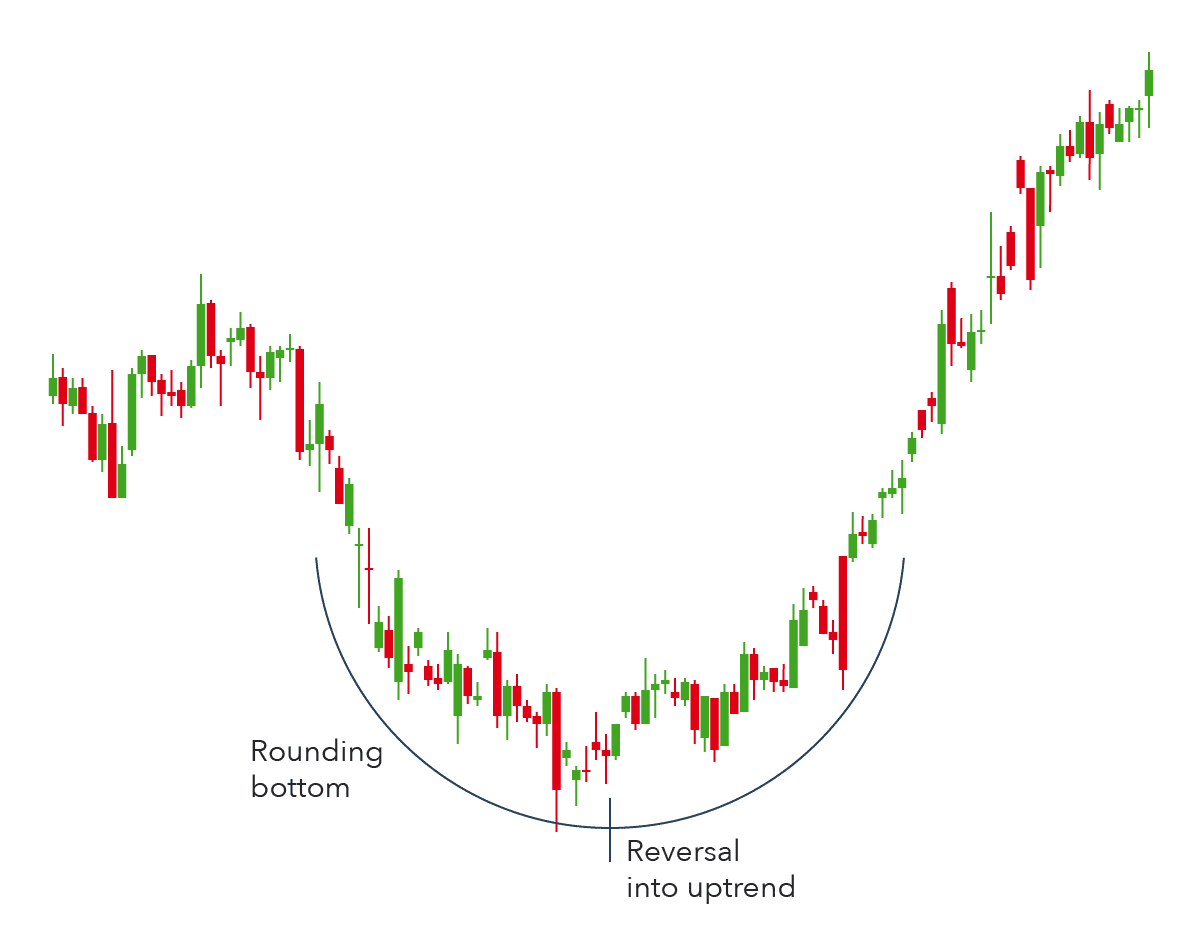
This crypto chart pattern typically occurs right before a trend reversal. The “top” pattern signals a possible bearish reversal, creating a potential shorting opportunity. The “bottom” pattern is the opposite and often precedes a reversal from a downward trend to an upward one.
The Failure Swing Trading Crypto Chart Pattern
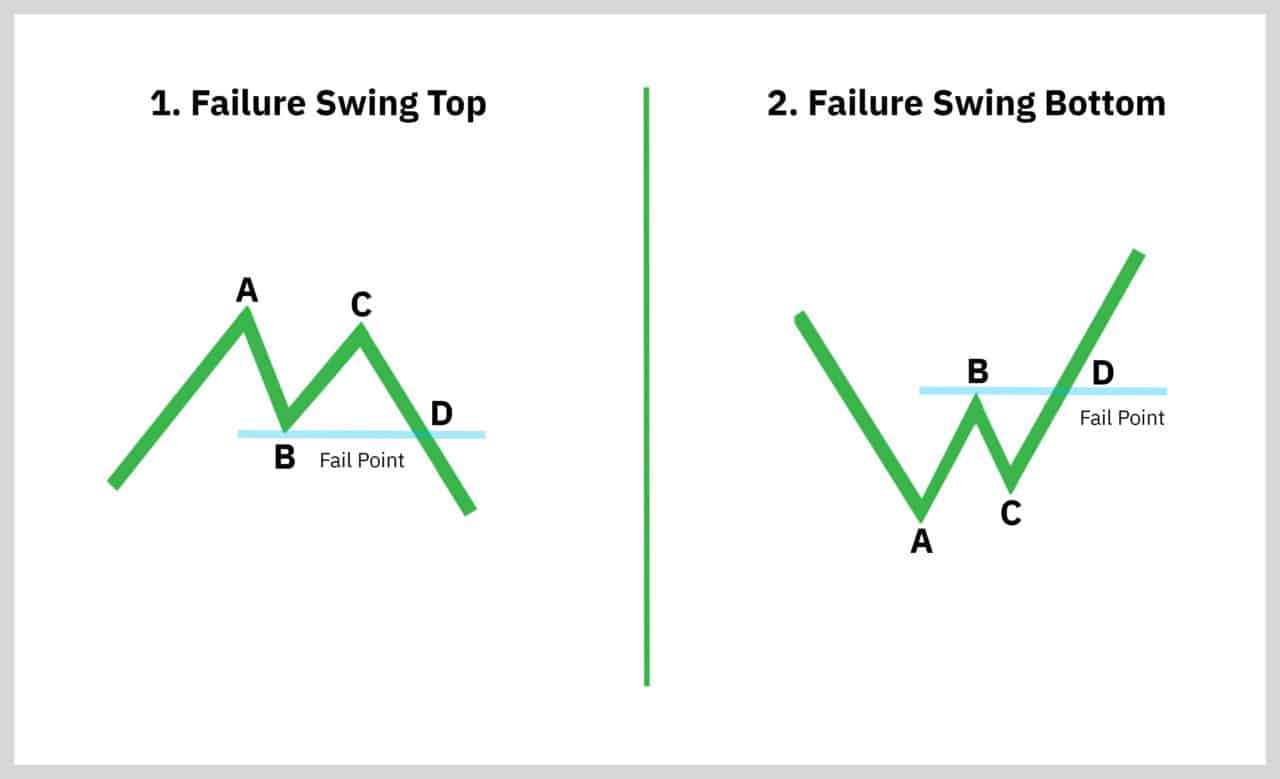
The failure swing chart pattern happens if the asset price reaches a certain level and then pulls back before reaching that level again. Common failure chart patterns typically involve trend lines, such as breakouts before a fail point, or descending triangles. When these patterns appear on charts, they may indicate that a reversal or pullback is due; however, false signals can occur if the underlying conditions or fundamentals do not support the formation of the pattern.
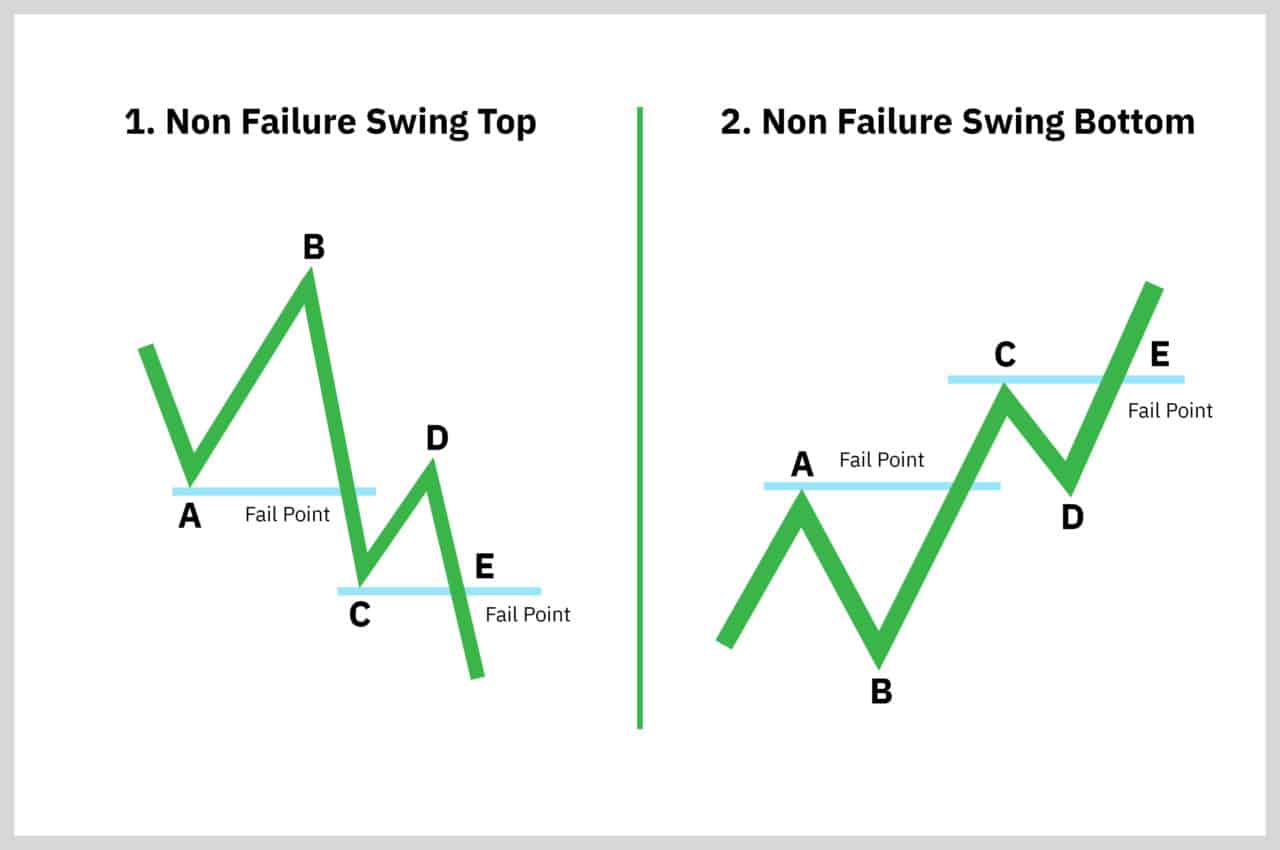
Non-failure swing chart patterns are similar to failure swing charts, but they involve the second peak staying above the first one (an upward continuation). Non-failure swings can indicate strong trends and sustained price movements. One should look at both types of patterns in combination with other market indicators to validate their accuracy.
How to Trade Crypto Using Chart Patterns
When it comes to trading crypto using chart patterns, there are a few things you need to keep in mind.
- Make sure that the chart pattern is valid. This means that it should meet all of the criteria we discussed earlier.
- Wait for a confirmation signal before entering a trade. A confirmation signal is something like a breakout or a candlestick pattern.
- Have a proper risk-reward ratio. This means that your potential profits should be greater than your potential losses.
- Have a plan for exiting the trade. This includes setting a profit target and a stop-loss order.

If you are an experienced trader or have a higher-than-average risk appetite, you can try to trade patterns before the confirmation. However, please remember that it is incredibly risky — not to mention insanely hard. While these patterns are easy to identify in retrospect, they can be not-so-easy to notice when they are just happening. Of course, ыщьу tools and indicators (or even bots) can help with that, and you will get better at catching them as you practice more, but they can still be incredibly treacherous.
Crypto Chart Pattern Success Rate
There are many different chart patterns that you can use to trade crypto, but not all of them are equally effective.
Some chart patterns have a higher success rate than others. For example, the head and shoulders pattern has a success rate of about 70%. On the other hand, the cup and handle pattern has a success rate of about 80%.
At the end of the day, what matters most is using the patterns that fit your trading strategy best, as well as utilizing proper risk management.
Risk Management
Risk management is incredibly important when it comes to trading crypto chart patterns. No matter how good or prominent the chart pattern is, things can always go wrong. So, it’s crucial to have a solid risk management strategy in place before you start trading and adjust it accordingly. Here are some things to keep in mind:
- Set a stop loss. This is probably the most important thing you can do in terms of risk management. A stop loss will help you limit your losses if the trade goes against you.
- Use a take profit target. A take profit target will help you lock in profits if the trade goes in your favor.
- Use a trailing stop. A trailing stop is a great way to protect your profits because it will automatically sell your position if the price starts to fall.
- Manage your position size. Position size also matters. You don’t want to risk too much of your account on one trade.
Hedging is also an important concept to understand when trading chart patterns. It involves opening a position in one asset to offset the risk associated with another asset.
For example, let’s say you’re long on BTC, and you’re worried about a potential market crash. You could hedge your position by going short in altcoins. This way, if the market does crash, your losses will be offset by your gains in altcoins.
These are just a few things to keep in mind in regard to risk management when trading chart patterns. If you can master risk management, you’ll be well on your way to success as a trader.
FAQ
Do chart patterns work for crypto?
Yes, chart patterns can be extremely useful for trading crypto. They may not be 100% reliable, but they can definitely help you make more informed trading decisions.
What is the best pattern for crypto trading?
There is no one “best” chart for crypto trading. It really depends on your preferences and goals.
How do you read a crypto chart pattern?
To make the most out of a crypto chart pattern, you need to pay attention to
- price movement (Are there higher highs or lower highs?)
- support and resistance levels
- the trend stage (Is the trend at the beginning, the middle, or the end?)
What technical analysis tools are the best for cryptocurrency trading?
There are a few technical analysis tools that can be really useful for cryptocurrency trading. Some of the most popular ones include:
- Moving Average (MA)
- Bollinger Bands
- Relative Strength Index (RSI)
- MACD indicator
How do you predict a crypto pump?
Predicting a crypto pump is no easy task, but there are a few things you can look out for that may give you some clues. These include:
- Increased social media activity
- Frequent occurrences of FOMO in the community
- Pump and dump groups
- Unusual trading activity on exchanges
How many chart patterns are there in crypto?

Plenty of chart patterns that can be used in crypto trading. In technical analysis, whose basics work for all financial markets, there are about 30 formations. These include head and shoulders, double tops and bottoms, triangles, wedges, flags and pennants, cups and handles, channels, and ranges. Each pattern has its own distinct characteristics and can be used to identify potential entry or exit points to make profitable trading decisions. Different crypto patterns will work better depending on the asset, so it is important for investors to know how each chart pattern applies to their specific situation.
Disclaimer: Please note that the contents of this article are not financial or investing advice. The information provided in this article is the author’s opinion only and should not be considered as offering trading or investing recommendations. We do not make any warranties about the completeness, reliability and accuracy of this information. The cryptocurrency market suffers from high volatility and occasional arbitrary movements. Any investor, trader, or regular crypto users should research multiple viewpoints and be familiar with all local regulations before committing to an investment.