MANA indicators flip bullish, but here’s why it could be a trap

Disclaimer: The information presented does not constitute financial, investment, trading, or other types of advice and is solely the writer’s opinion.
- The market structure was bearish but the indicators noted a shift in momentum
- The bulls looked unlikely to regain control in the coming days
Back in January, Decentraland registered a strong rally in the price of its token. This was not unique to MANA, but was a result of a shift in sentiment across the market. After posting gains of 184% in a month, MANA faced rejection multiple times around the $0.8-resistance level.
Read Decentraland’s [MANA] Price Prediction 2023-24
Over the past two weeks, the previous uptrend began to shift more and more in favor of the sellers. The crypto began to register lower highs. Last Friday, it broke under a critical level of support and looked likely to register further losses.
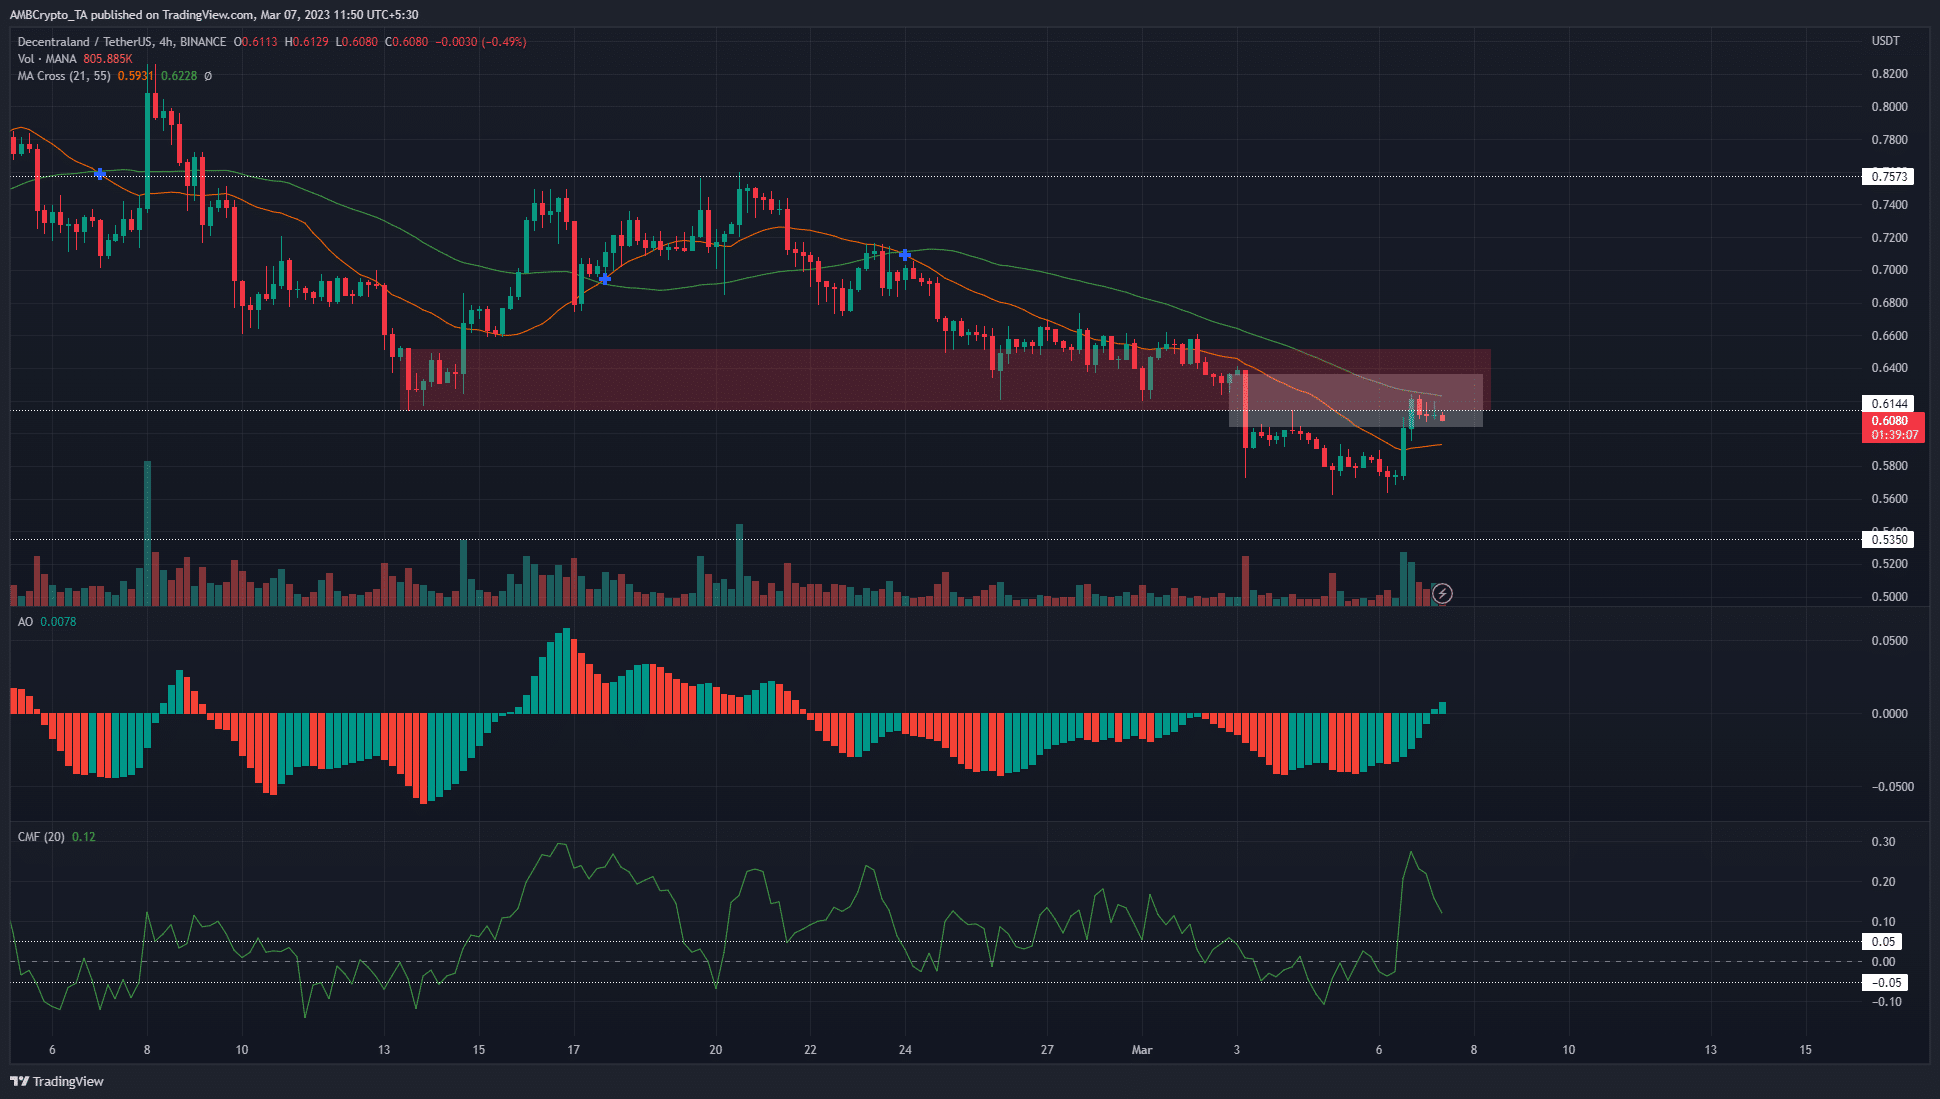
The confluence of resistances at $0.634 could be extremely difficult to beat

Source: MANA/USDT on TradingView
The 4-hour indicators highlighted buyers could be in the ascendancy. The Awesome Oscillator crossed over above the zero line to show bullish momentum was strengthening. The CMF had a reading of +0.12 and underlined huge capital inflows to the market. Both indicators suggested further gains can follow, but the 21 and 55-period moving averages showed that a downtrend was in progress.
And yet, MANA traded beneath the resistance at $0.614. When the prices dropped from $0.64 to $0.574 on 3 March, it left behind a huge imbalance on the charts, which was shown by the white box.
Realistic or not, here’s MANA’s market cap in BTC’s terms
A bullish order block from 13 February was broken during this dump and is now a bearish breaker block. Highlighted in red, this box has confluence with the resistance at $0.614 and the fair value gap. The market structure on H4 was also strongly bearish as MANA formed lower highs and lower lows since 24 February.
Therefore, another move south seemed very imminent. To the south, the next support level was at $0.57 and $0.535.
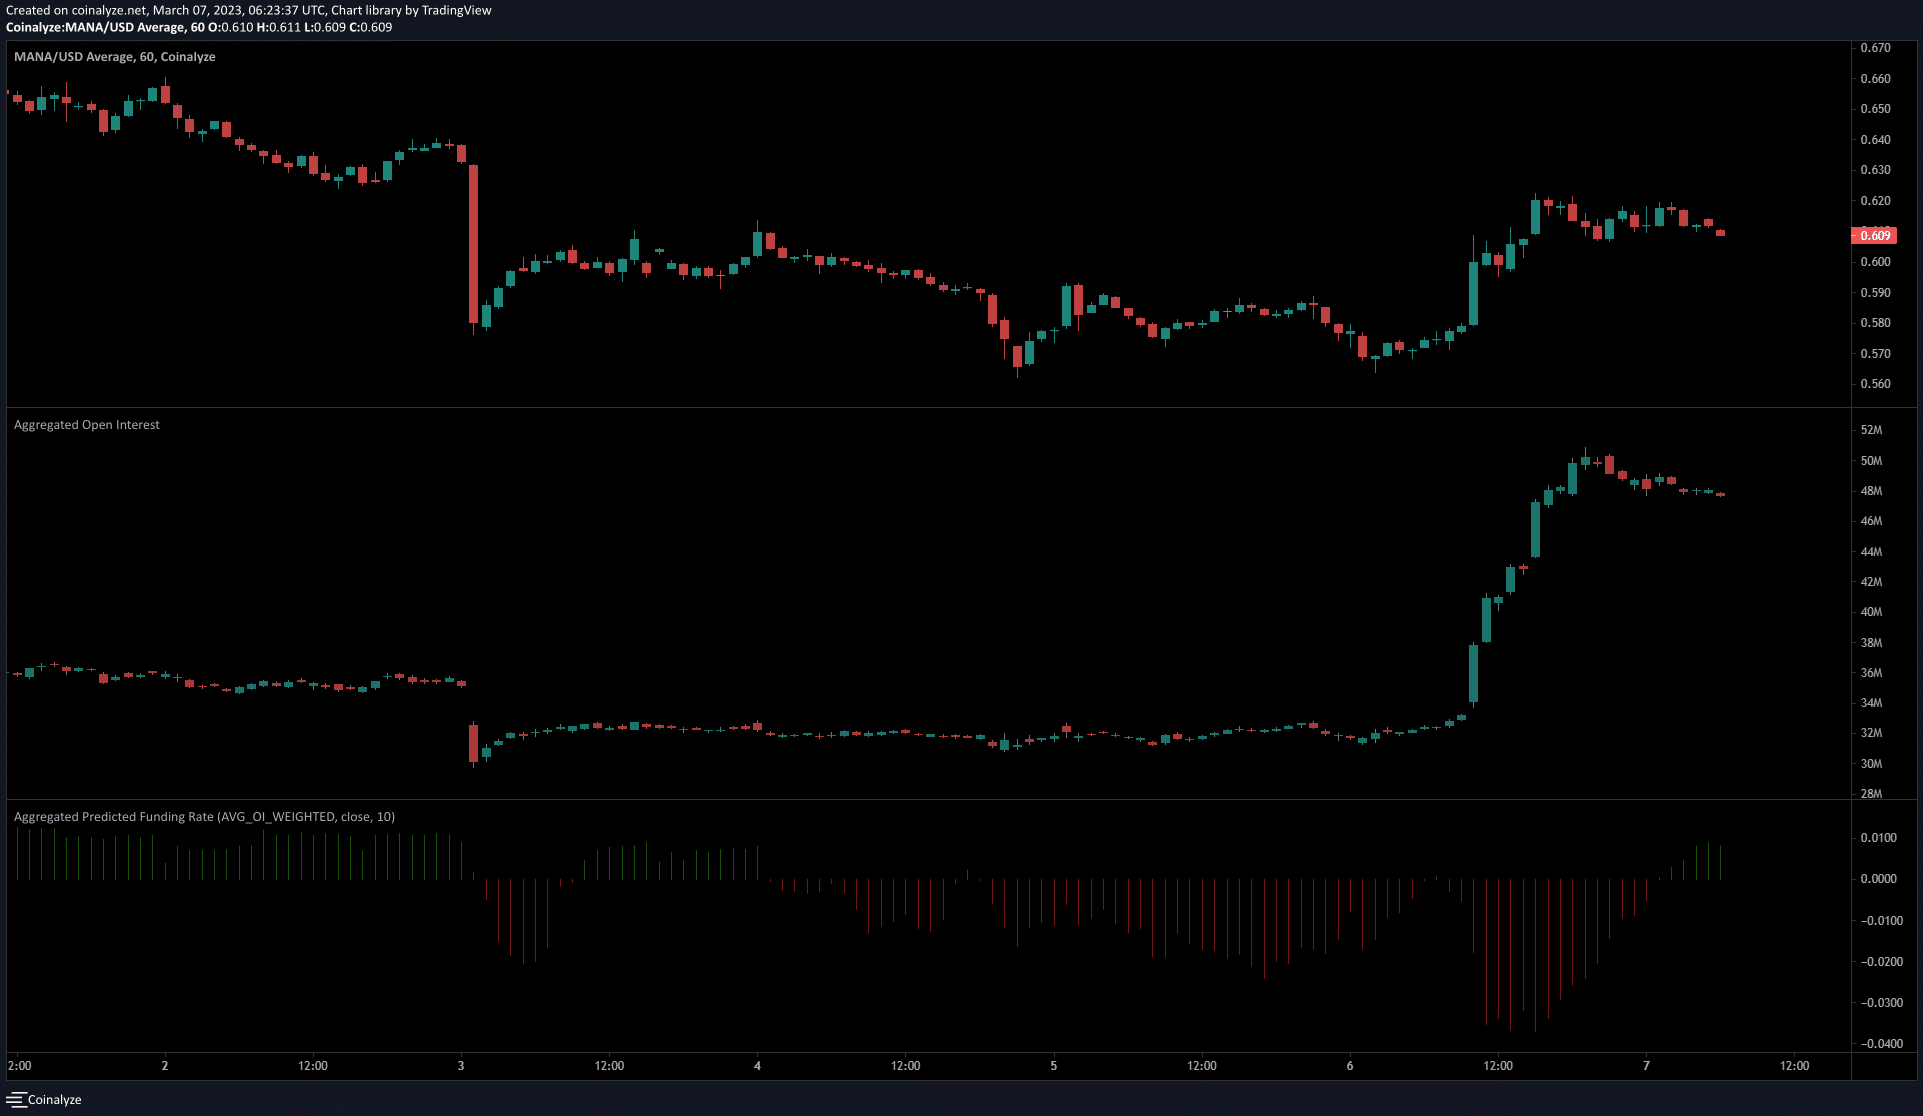
The strong spike in Open Interest showed short-term sentiment was bullish

Source: Coinalyze
The 15-minute chart revealed that when MANA recovered from $0.57, the Open Interest soared alongside it. This lower timeframe rally petered out at $0.62, but it still represented gains of close to 9%. This was a significant move from a scalper’s perspective.
While the spike in OI showed bulls fueled this rally, the OI began to recede over the last few hours before press time. Meanwhile, the funding rate remained positive and highlighted that some bullish sentiment was present.


