Litecoin Validates A Bearish Pattern – Will LTC Price Force Buyers To Exit?

As Bitcoin price struggles to maintain its momentum above the crucial $28K mark, it triggers a selling wave in leading altcoins. The ‘Uptober’ trend appears to be fading as leading altcoins, including LTC, flash red, signaling potential dips after validating a bearish pattern. With several on-chain data now indicating bearish signs, LTC price seems poised for another surge of selling pressure.
Litecoin’s Long/Short Ratio Surges Near The Dip
Following a drop in LTC price from $68, buyers rushed to sell off their positions to sidestep further losses. Coinglass data unveils that almost $1.6 million in long positions were liquidated in the past 48 hours. This activity has gradually strengthened the resistance level, paving the way for sellers to potentially capitalize on reversing the trend.
Additionally, Litecoin’s trading interest has declined, evidenced by a sharp decrease in the Open Interest (OI) metric. The OI metric plummeted by more than $11 million in the recent 24 hours, as LTC’s declining volatility struggled to capture market interest. Data from IntoTheBlock highlights a downturn in LTC’s volatility, which has been gradually decreasing for over a week, sliding from a peak of 38.4% to a low of 31.9%. This has emerged as a primary factor in Litecoin’s price decline.
Nonetheless, after the LTC price touched the $63 mark, a boost in confidence among long position holders was observed. The long/short ratio indicates a surge, currently trading at 0.9897, hinting at a fierce struggle between bulls and bears. At present, bulls are asserting their dominance with 49% long positions, while bears are responding with 51% short positions. Consequently, LTC price has managed to sustain a steady momentum below the $65 threshold.
What’s Next For LTC Price?
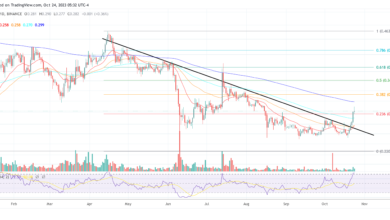
Litecoin price surged above $68 but failed to meet buyers’ expectation as sellers triggered intense pressure near this high. As a result, LTC price declined and buyers attempted to hold the momentum near $65 but failed due to increasing domination from sellers. As of writing, LTC price trades at $64.1, declining over 2.7% in the last 24 hours.
Typically, the rise of a bearish setup is viewed positively, as bulls, previously on standby, seize the opportunity to buy. After Litecoin reached the dip of $63, buyers bought in and pushed the price above 23.6% Fib channel. However, the price might soon dip and retest the breakout level of $62 before any significant upward movement occurs.
If the level of $62 sustains, it would indicate that bulls have successfully converted the region into a strong support. Hence, the Litecoin price might initiate an upward trajectory towards $65 and potentially further to $68 if it rebounds successfully.
Conversely, if the price declines and drops below the initial bearish zone, it would suggest that the markets have rebuffed the higher levels. The price might then visit the crucial support at $57.


