Latest Bitcoin (BTC) Crash the Final Fakeout Before Mega Expansion, According to Crypto Analyst

History suggests that the current Bitcoin (BTC) correction could be the final fakeout to the downside before the crypto king explodes on a new macro bull run, according to an analyst.
The pseudonymous analyst known as TechDev tells his 417,000 X followers that if past cycles are an indicator of what’s to come, Bitcoin’s recent crash to the $25,000 level might act as a spring for a new expansion up.
“Either the months ahead surprise the market yet again, or this time is truly different.”

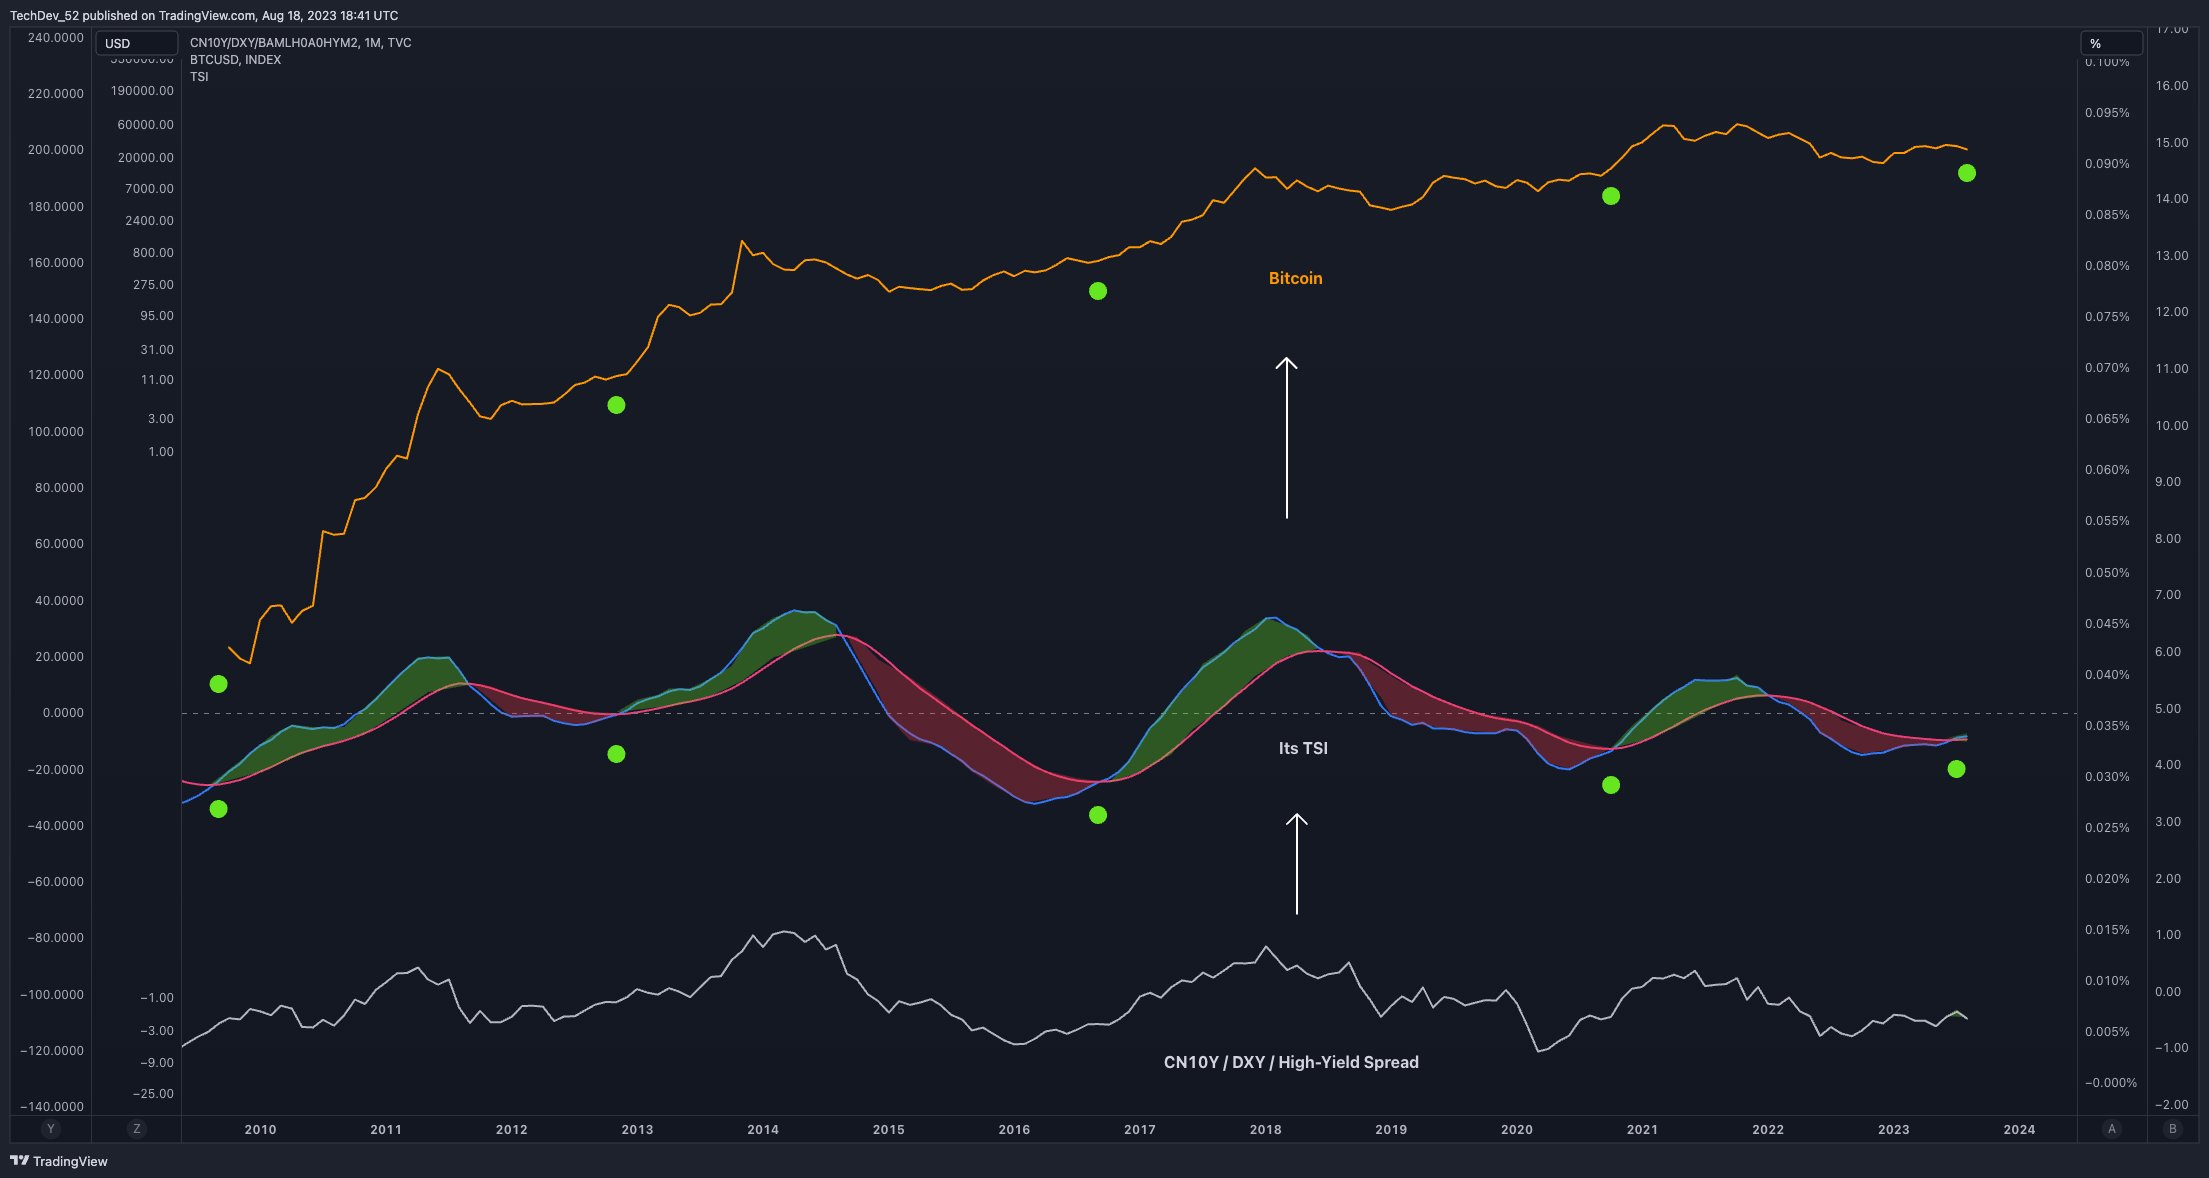
The trader has been known to watch the global liquidity cycles, which he portrays by pitting the Chinese 10-year bonds (CN10Y) against the US dollar index (DXY). TechDev’s chart appears to be using the true strength indicator (TSI) to gauge the momentum of the CN10Y versus the DXY.
TechDev’s chart suggests that the TSI is flashing a bullish cross, a technical reading that is also present at the start of previous Bitcoin bull markets.
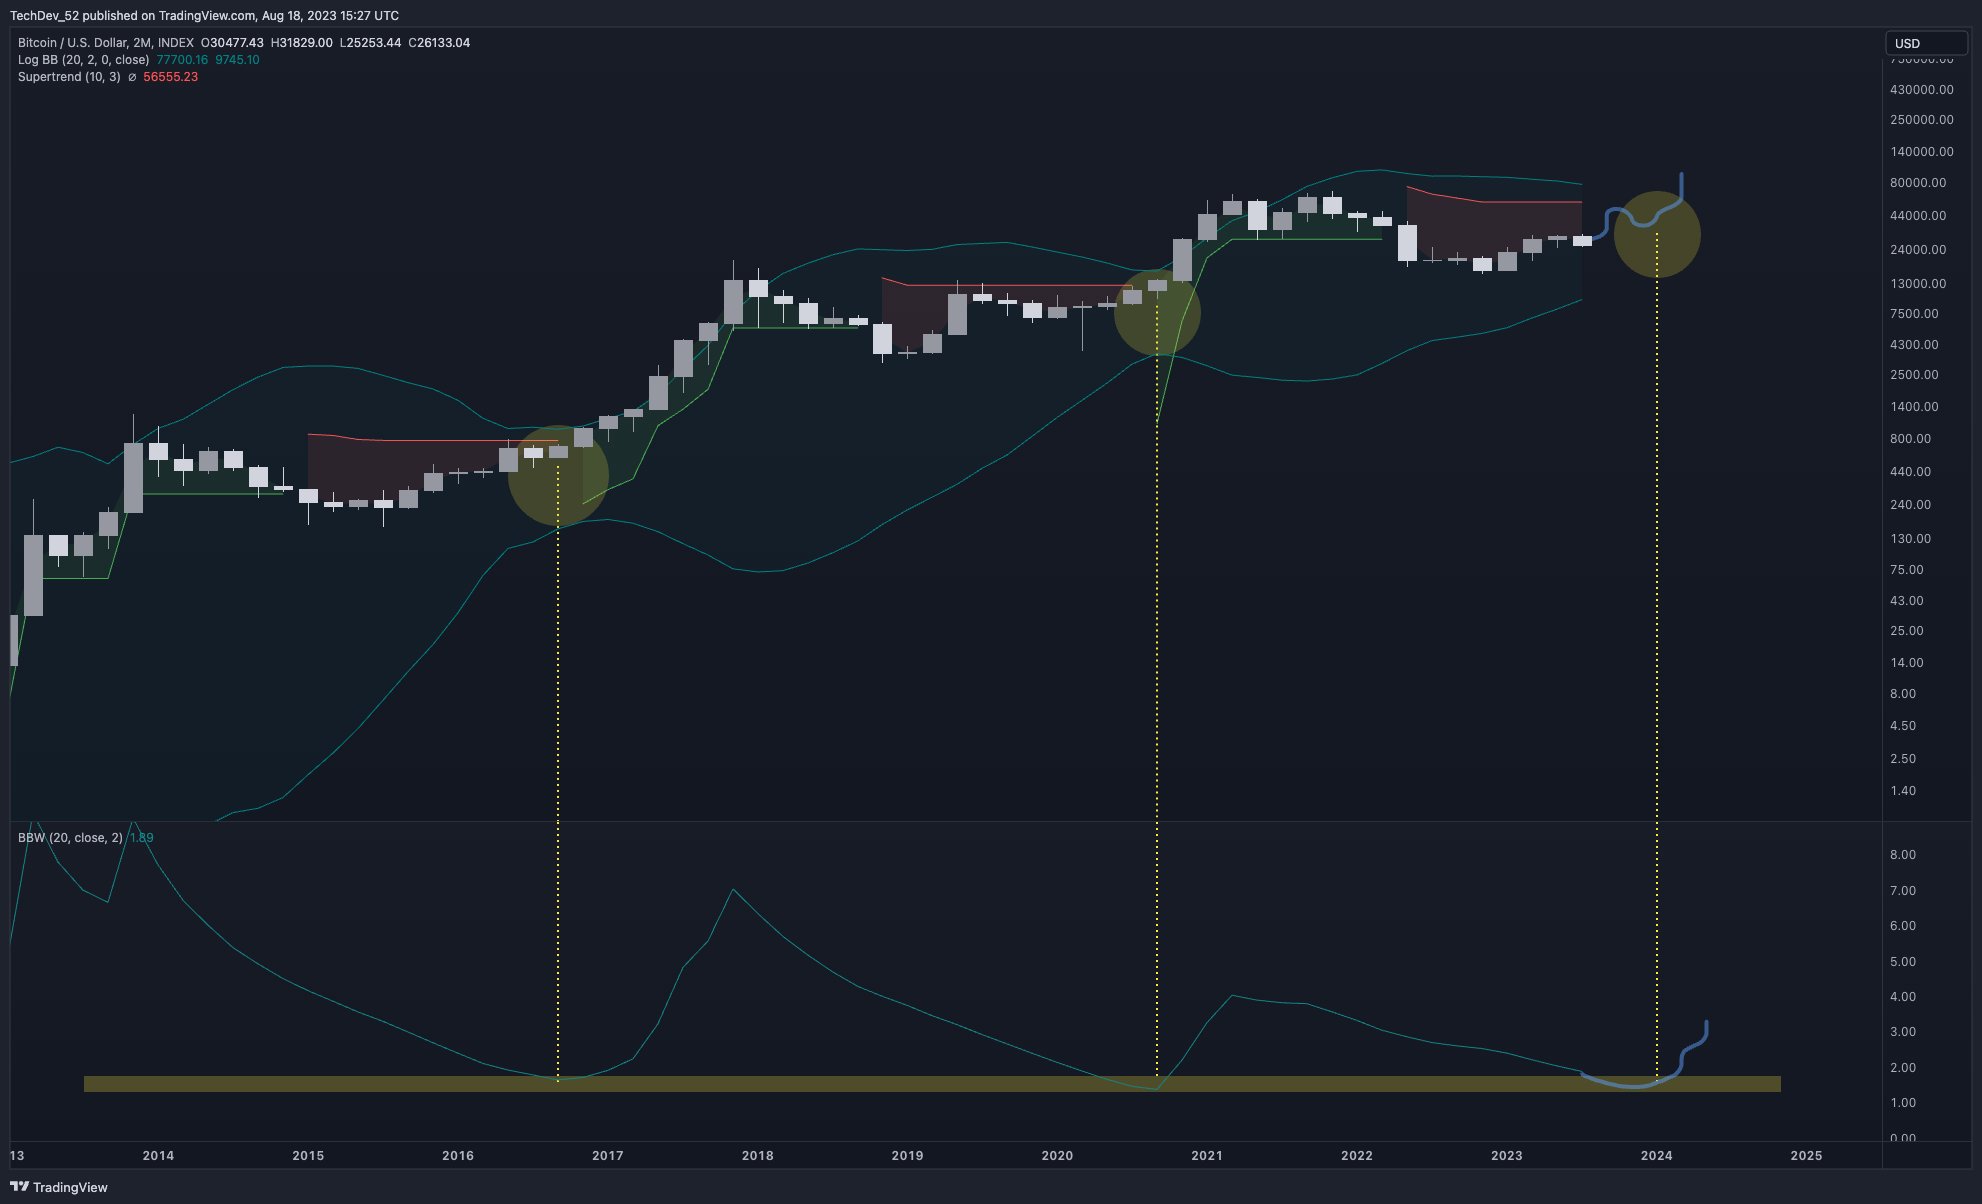
TechDev is also basing his analysis on the supertrend indicator, which generates bull and bear signals based on whether the price breaks previous open or close levels during a given period.
He says that an optimal scenario for Bitcoin would be a run-up to the two-month supertrend level of around $50,000, represented by the red line on the chart, before testing support near $30,000 or so and then launching into a parabola.
According to TechDev, the move will enable Bitcoin’s two-month chart to drop to the support area of the Bollinger bands width (BBW) indicator, a level which signaled the start of the 2017 and 2020 bull markets.
Traders use the BBW indicator to gauge an asset’s volatility.
Says TechDev,
“Want to see a move up to two-month supertrend + retest to complete two-month compression.”

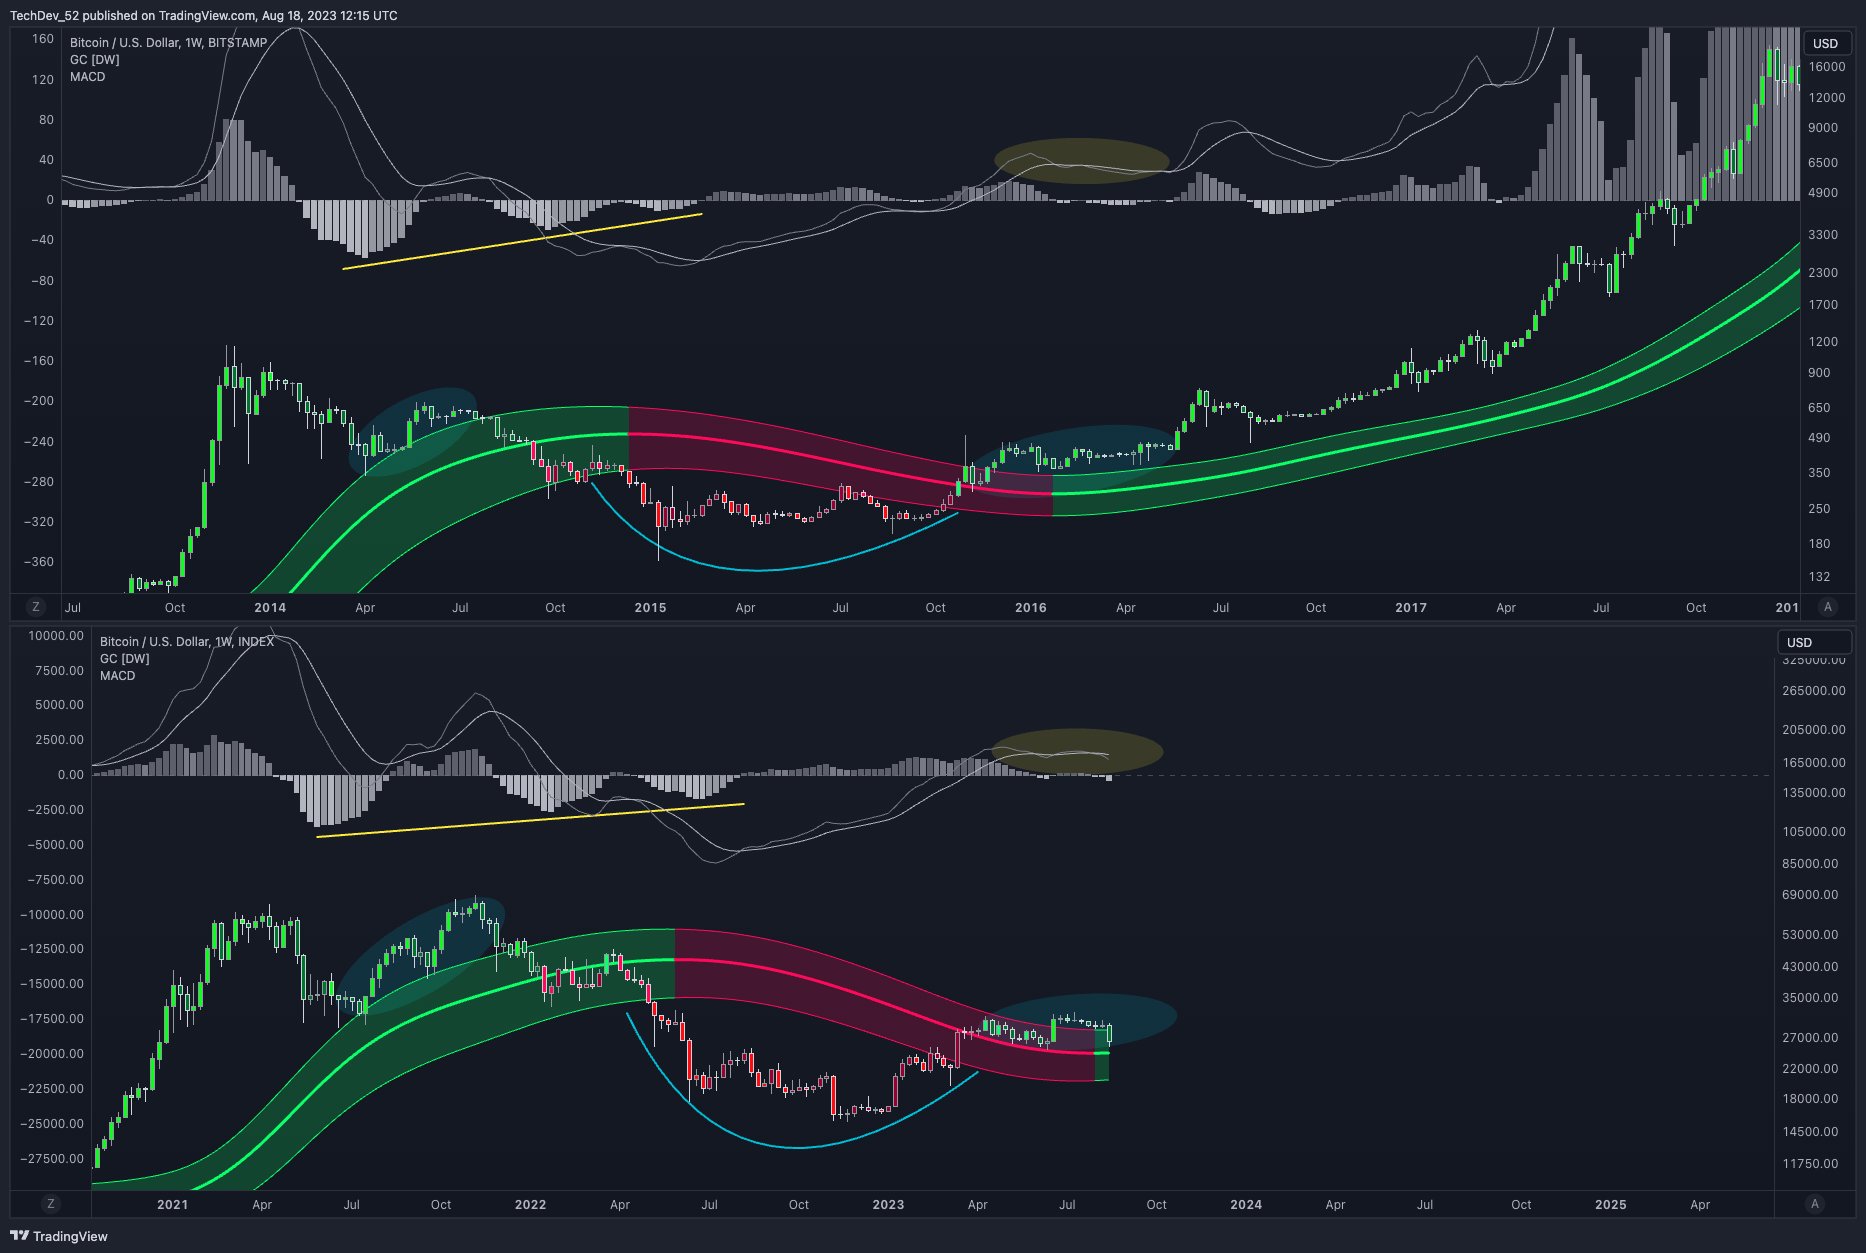
The analyst also makes a comparison between now and 2016, where BTC spent several months above the Gaussian Channel testing it as support while consolidating before moving into a clear uptrend.
Based on the comparison, BTC may be repeating its 2016 recovery by consolidating just above the Gaussian Channel for a lengthy period of time before grinding up to all-time highs.
The Gaussian Channel is an indicator that attempts to define the trend of an asset.
Says TechDev,
“Stay above Gaussian Channel center.”

At time of writing, Bitcoin is worth $26,116.
Don’t Miss a Beat – Subscribe to get email alerts delivered directly to your inbox
Check Price Action
Follow us on Twitter, Facebook and Telegram
Surf The Daily Hodl Mix
 

Disclaimer: Opinions expressed at The Daily Hodl are not investment advice. Investors should do their due diligence before making any high-risk investments in Bitcoin, cryptocurrency or digital assets. Please be advised that your transfers and trades are at your own risk, and any loses you may incur are your responsibility. The Daily Hodl does not recommend the buying or selling of any cryptocurrencies or digital assets, nor is The Daily Hodl an investment advisor. Please note that The Daily Hodl participates in affiliate marketing.
Generated Image: Midjourney


