- The Ripple (XRP) price has fallen after a rejection from a resistance area.
- While the price action is bearish, the wave count is showing bullish signs.
- A drop below $0.433 would confirm that the trend is bearish.
- PROMO

The Ripple (XRP) price fell sharply on April 19 after a crucial resistance area rejected it.
Despite the fall, the wave count offers hope for a potential reversal as long as the price reaches a bottom soon. Will XRP be able to recover its bullish structure?
Ripple Price Struggles With Resistance
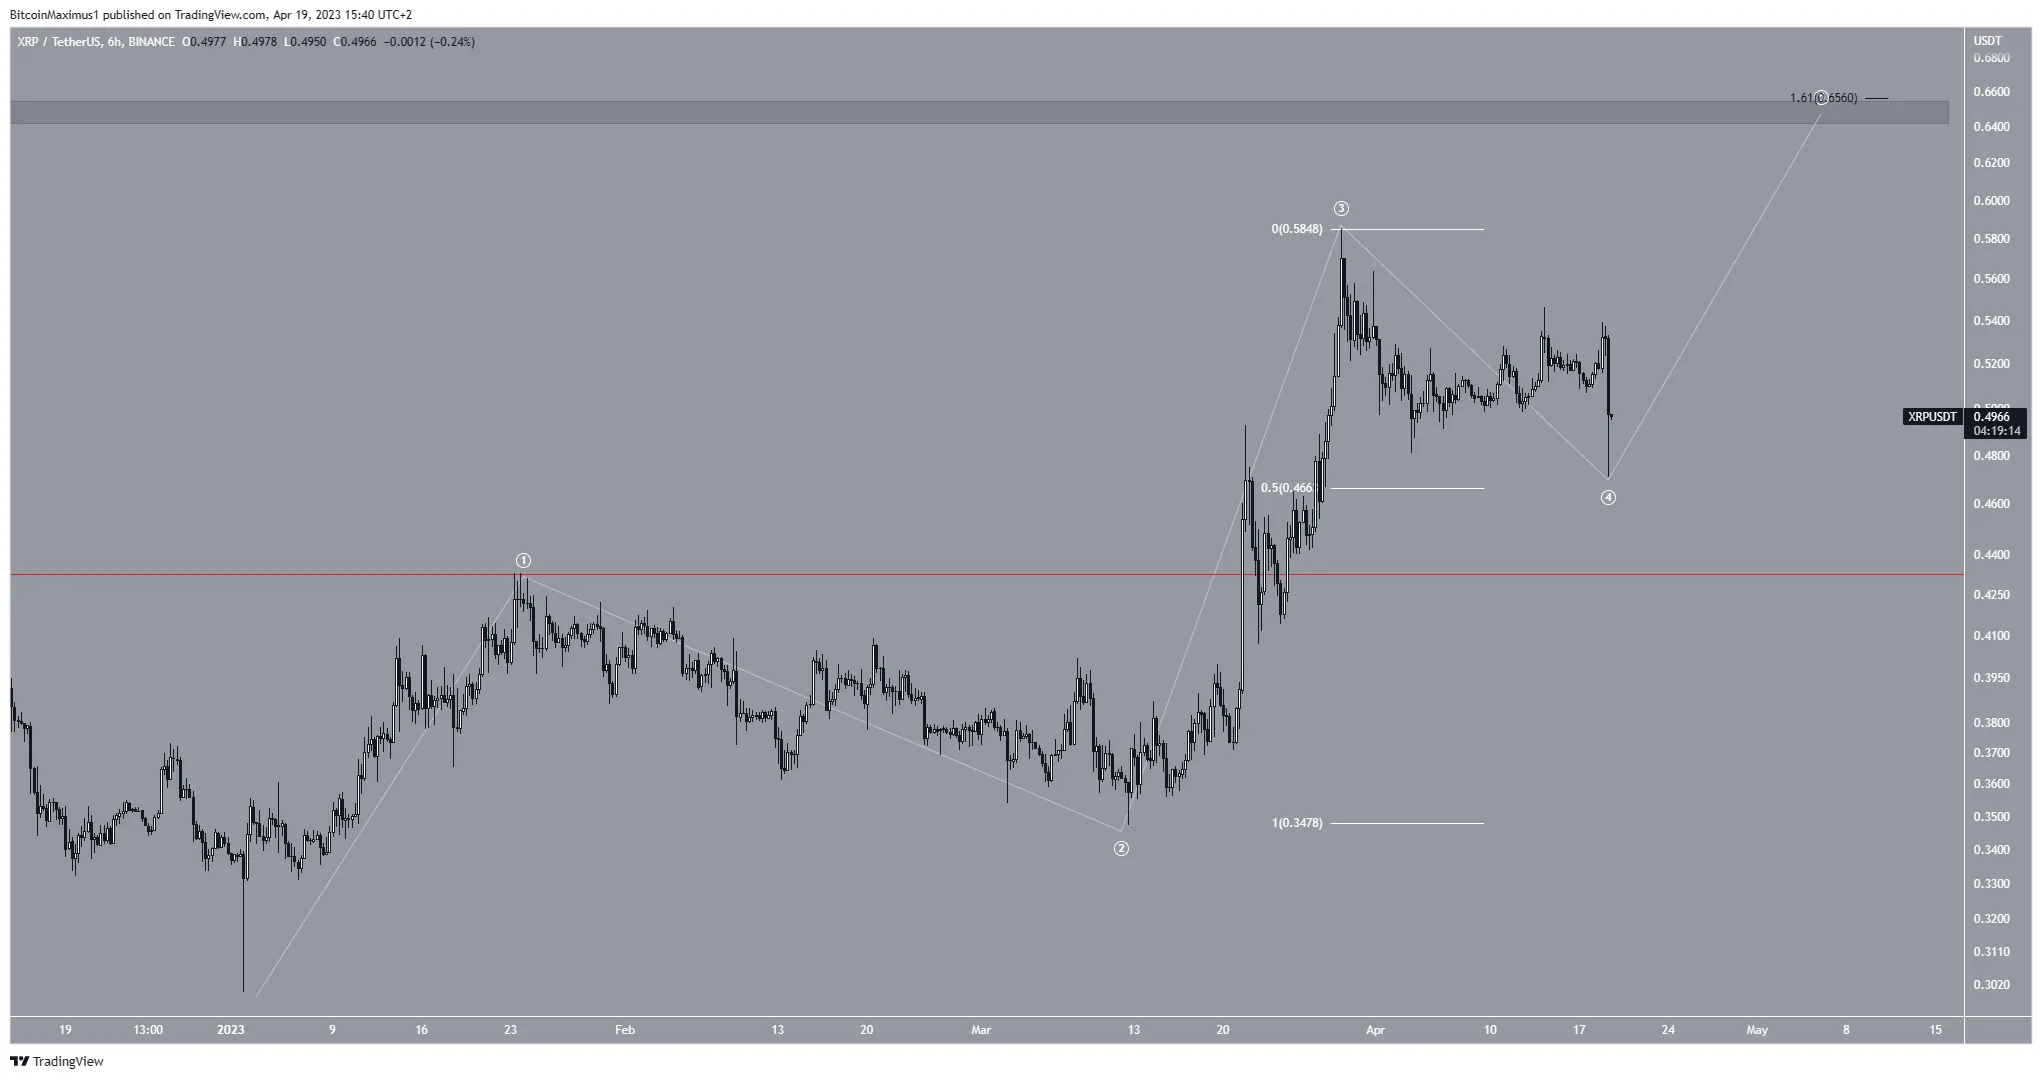
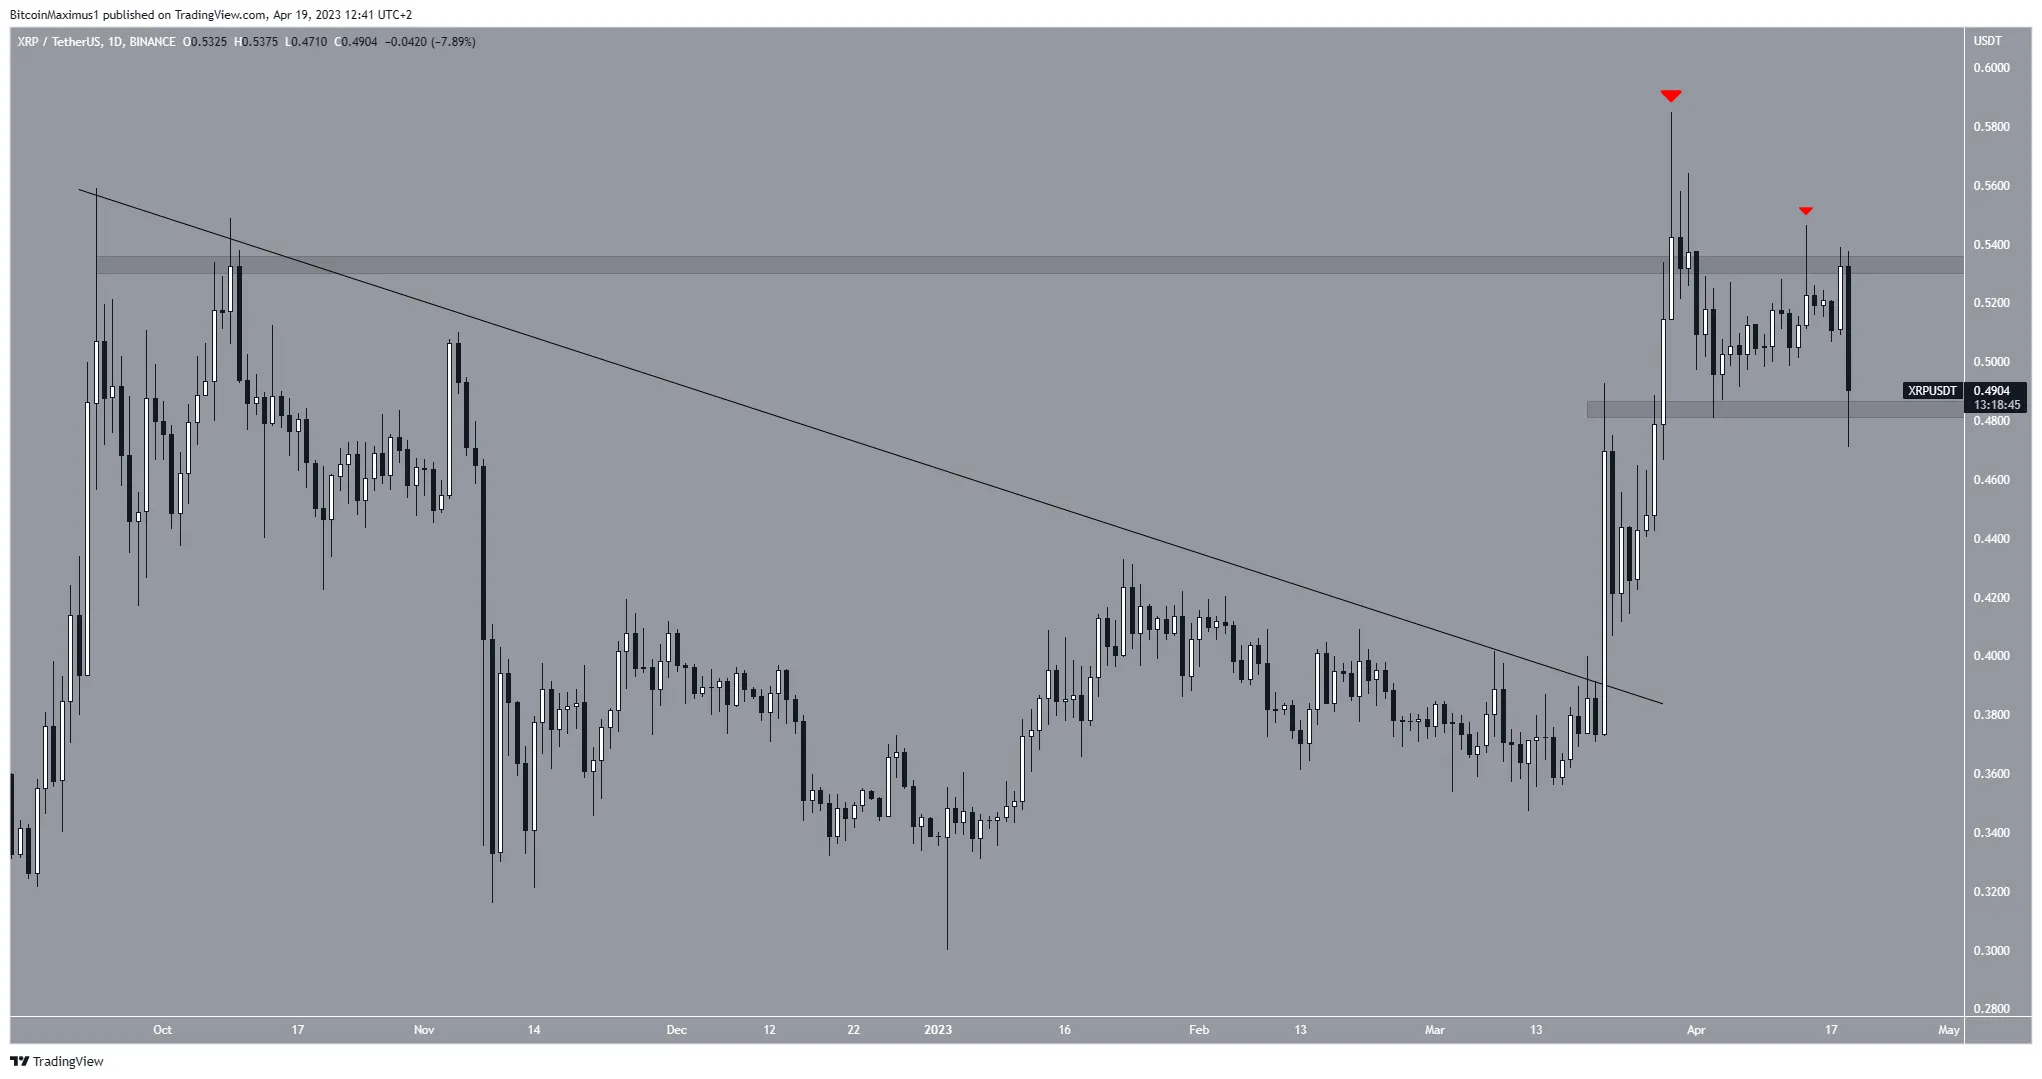
The XRP price has increased since breaking out from a descending resistance line on March 21. The breakout from the line suggested that the previous correction had ended. It led to a new yearly high of $0.585 on March 29.
Initially, the price seemed to have cleared the $0.530 resistance area. However, XRP created a long upper wick and fell. The wick is considered a sign of weakness. It means buyers could not sustain the price, and sellers took over, driving it down. A similar wick on April 14 (red icon) supports this possibility. So, the $0.530 area now acts as resistanceagain.
Moreover, the digital asset is in the process of creating a bearish engulfing candlestick. This is a type of bearish candlestick in which the entire previous increase is negated in one day. It aligns with the previous bearish readings regarding the long upper wicks.
XRP Price Prediction: How Can the Price Recover?
The technical analysis from the short-term six-hour count offers a bullish XRP price forecast. The main reason for this is the wave count. Elliott Wave theory is a tool used by technical analysts. It looks for recurring long-term price patterns and investor psychology in order to determine the trend’s direction.
According to it, it appears that the current price is in the fourth wave of a five-wave increase (white). This is a positive indication for XRP’s future price, suggesting that it could potentially surpass the $0.525 resistance are and reach $0.650.
The fourth wave’s price movement will determine the future trend’s direction. At present, the most likely pattern for completing the corrective wave is a bounce at the 0.5 Fib retracement support level.