Bitcoin [BTC] may look poised to hit $25K, but here’s the ‘but’ of it all

- BTC’s price has rallied significantly over the last 24 hours
- Its current set-up on the 12-hour chart, however, does raise a few questions about its short-term
During the intraday trading session on 13 March, sentiments across the cryptocurrency market improved. This, following the decision by the U.S. Department of the Treasury, Federal Reserve, and Federal Deposit Insurance Corporation (FDIC) to restore all customer deposits at failed Silicon Valley Bank (SVB).
As trading activity spiked, Bitcoin’s [BTC] price rallied above $24,000 for the first time in over two weeks. On the contrary, BTC had previously traded below the $20,000-level on 11 March when SVB collapsed.
Is your portfolio green? Check out the Bitcoin Profit Calculator
Short traders are the biggest losers
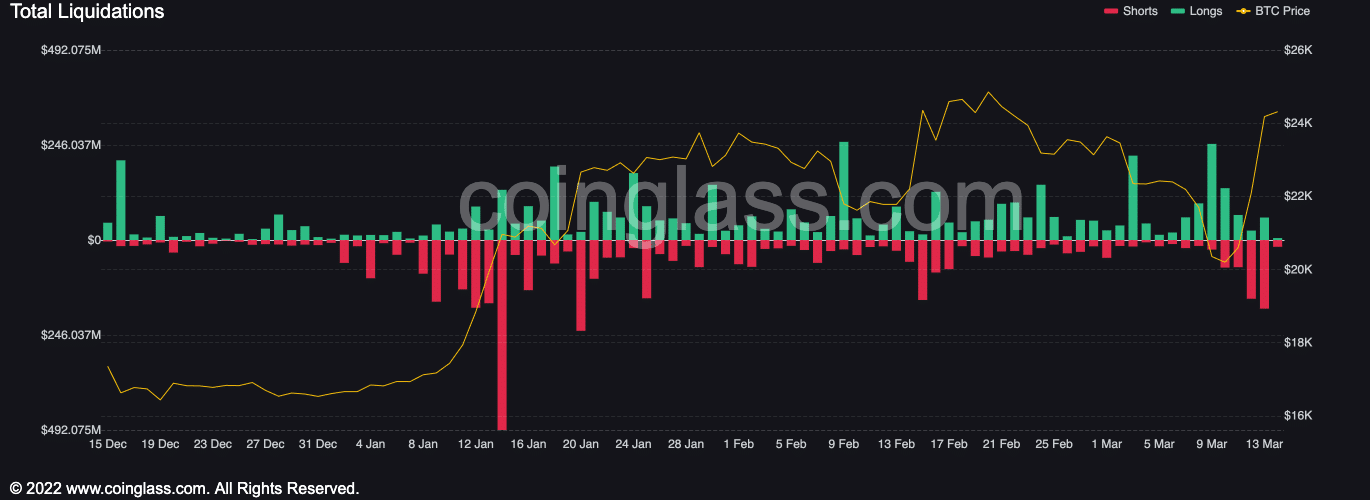
At press time, BTC was valued at $24,455 on the price charts, having rallied by almost 10% over the last 24 hours. Due to the uptick in price caused by the unexpected bailout of SVB depositors by Federal regulators, traders who had opened short-trading positions were caught off-guard and plunged into losses.
In fact, according to Coinglass, 55,851 traders were liquidated in the general cryptocurrency market, with $216.47 million removed in the last 24 hours. For the king coin, 4,300K BTC worth $104.46 million were taken off the market during that period, mostly made up of short positions. Additionally, during the trading session yesterday, as BTC’s price rallied above $24,000, over $81 million of BTC short positions were wiped out of the market.

Source: Coinglass
Furthermore, many BTC investors have taken advantage of the price rally to cash in profits on their investments.
According to on-chain data provider Santiment, on 13 March, BTC saw the movement of 21,524 BTC back to exchanges – The highest daily amount since 13 September 2022. “Traders are profit-taking while they can,” Santiment observed.
🥳👋🏦 #Bitcoin has gained ground on #altcoins on a big rebound day in the midst of the #SiliconValleyBank collapse & dollar falling. 21,524 $BTC have moved back to exchanges, its largest amount since Sep 13, 2023. Traders are profit taking while they can. https://t.co/82T3d778k8 pic.twitter.com/bOR7W8Ww67
— Santiment (@santimentfeed) March 13, 2023
$25,000 upon us?
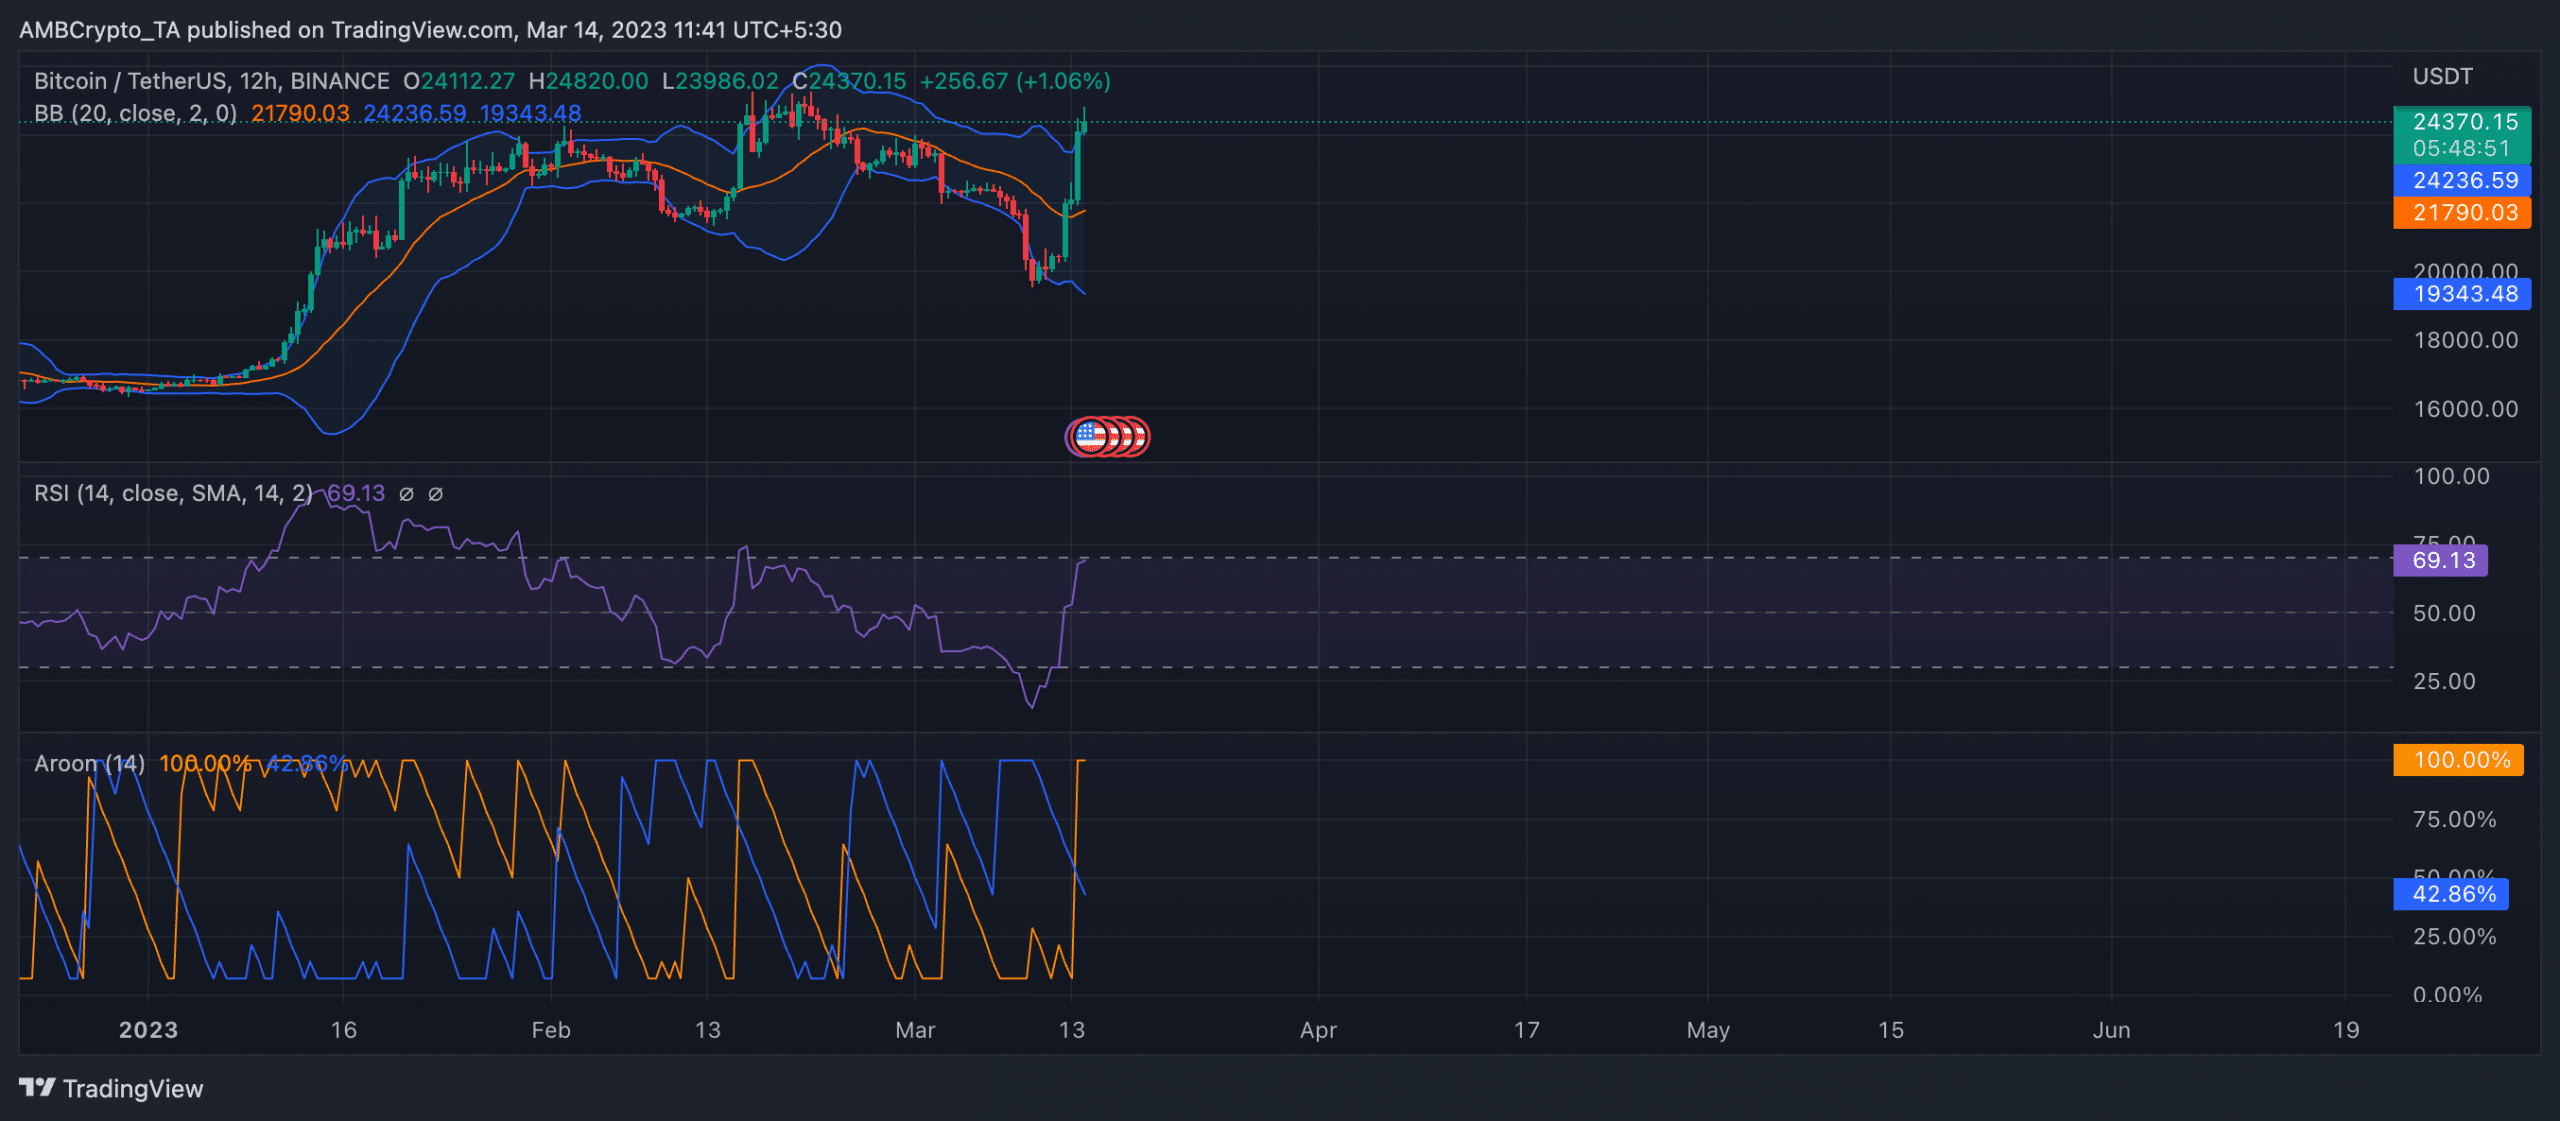
While many expect BTC’s price to reclaim the psychological $25,000-level very soon, its set-up on the 12-hour chart indicates that its price might see a correction soon.
At press time, BTC’s price was trading above the upper band of the coin’s Bollinger Bands metric. While this was a sign that the coin was overbought and the outlook remained bullish, it is often taken as an indication to exit the market. This, because many expect the price to correct at this point.
Read Bitcoin [BTC] Price Prediction 2023-24
Also, a key momentum indicator – Relative Strength Index (RSI) – rested at 69.13, at the time of writing, close to the overbought territory. Once it breaches this point, sentiment will change and many will take it as a sign to exit trading positions. This might drag the coin’s price down the charts.
Finally, BTC’s Aroon Up Line (orange) was spotted at 100%. When the Aroon Up line is close to 100, it indicates that the uptrend is strong and that the most recent high was reached relatively recently. This high could indicate a potential trend reversal in the cryptocurrency’s price.

Source: BTC/USDT on TradingView


