Analyst Says Traders Are Sleeping on Shiba Inu’s Biggest Rival and Three Additional Altcoins
A popular crypto analyst believes traders are starstruck by the rise of Shiba Inu (SHIB) and sleeping on Dogecoin (DOGE).
Pseudonymous analyst Smart Contracter tells his 220,200 Twitter followers that the ninth-largest crypto asset by market cap is now showing strength when paired against Bitcoin (BTC).
Based on Smart Contracter’s chart of DOGE/BTC on the three-day time frame, it appears that Dogecoin formed an inverse head and shoulders pattern in 2022.
The trader says few have noticed DOGE just bounced above a key trendline.
“Zoomed out DOGE/BTC chart.
This thing is literally putting in a god tier low and no one cares.”
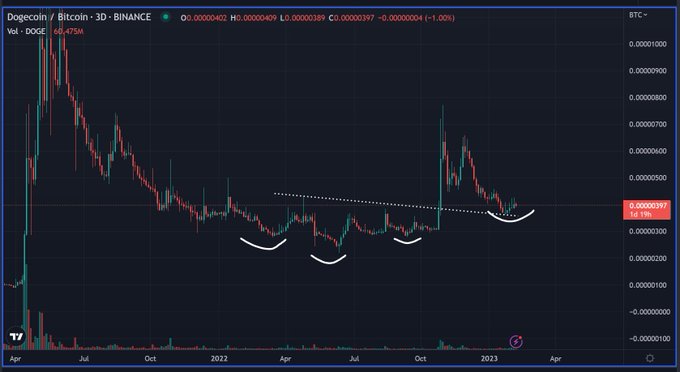
Dogecoin is trading at 0.00000397 BTC at time of writing, priced at $0.086687.
Turning to the utility token of the privacy-enhancing network for social media platforms, Mask Network (MASK), Smart Contracter says that the altcoin is preparing for the next bullish wave.
Based on his chart, the analyst who regularly applies the Elliott Wave theory in his technical analysis is predicting that MASK could soar by over 50% from current levels.
“Ready for the next leg up on MASK.”
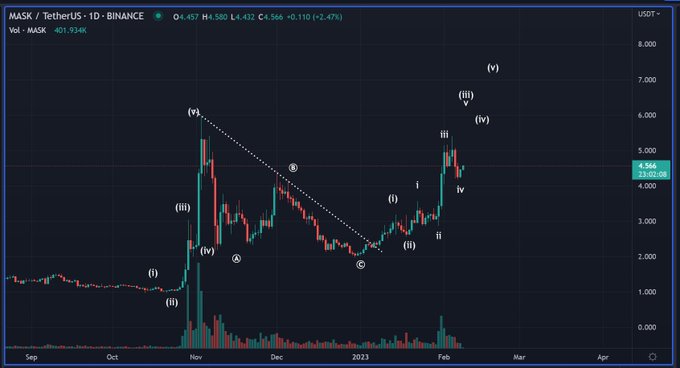
Mask Network is trading at $4.56 at time of writing.
Next up is Curve DAO (CRV), the utility token that powers the ecosystem of decentralized exchange Curve Finance.
Smart Contracter says that the altcoin is forming a re-accumulation triangle when paired against the dollar and Bitcoin, which typically signals an upward trend is on the horizon.
“Nice contraction on CRV four-hour time frame on dollar pair and Bitcoin pair.
I do love a good re-accumulation triangle.”

CRV is trading at $1.12 at time of writing.
The fourth crypto asset that Smart Contracter is targeting is the blockchain indexing protocol, The Graph (GRT).
The trader says GRT may have completed a corrective wave and could now resume the main upward trend.
Under the Elliott Wave theory, the main trend consists of a five-wave pattern while a correction occurs in a three-wave pattern, sometimes labeled as the A-B-C wave.
“Nice 20% dip on GRT looking like an A-B-C on hourly.
I’d be super surprised if it’s actually topped after a daily like we just had.
Stop placement is kind of hard though with it basically being parabolic, still expecting higher.”
The Graph is trading at $0.185 at time of writing.
Don’t Miss a Beat – Subscribe to get crypto email alerts delivered directly to your inbox
Check Price Action
Follow us on Twitter, Facebook and Telegram
Surf The Daily Hodl Mix
 

Disclaimer: Opinions expressed at The Daily Hodl are not investment advice. Investors should do their due diligence before making any high-risk investments in Bitcoin, cryptocurrency or digital assets. Please be advised that your transfers and trades are at your own risk, and any loses you may incur are your responsibility. The Daily Hodl does not recommend the buying or selling of any cryptocurrencies or digital assets, nor is The Daily Hodl an investment advisor. Please note that The Daily Hodl participates in affiliate marketing.
Featured Image: Shutterstock/Alberto Andrei Rosu/Sensvector

