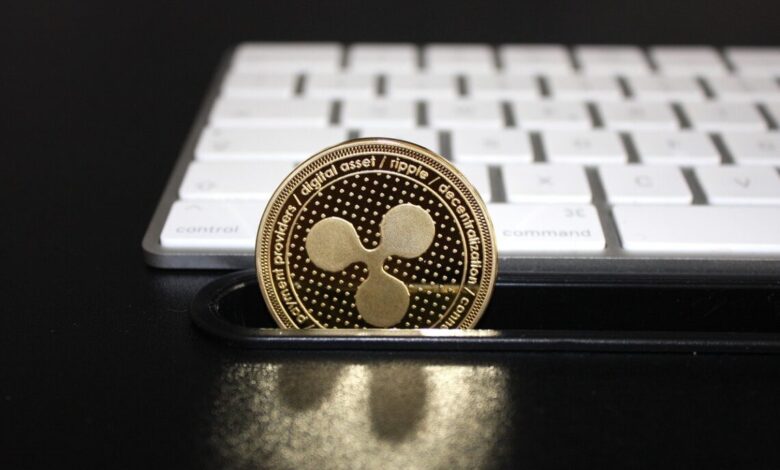
How XRP Current Value Signals An Imminent Market Triumph

Ben Armstrong, a well-known crypto analyst and YouTuber has recently offered an intriguing perspective on XRP’s current trading value.
XRP, a token closely watched in the crypto community, particularly after its legal battle with the US Securities and Exchange Commission (SEC), currently trades at around $0.60. While this figure might not represent an all-time high, Armstrong highlights why this price point might be pivotal for XRP.
The Bigger Picture: Institutional Interest And Market Dynamics
Armstrong’s analysis begins with the “adamantium” support level of $0.60 for XRP. Drawing an analogy with the fictional character Wolverine, who famously recovers from severe damage, Armstrong sees XRP’s resilience at this price as a sign of robustness.
Each time XRP’s value dips, it seemingly rebounds from this critical support level, suggesting a strong market faith in the token.
Armstrong goes beyond price analysis to consider broader market dynamics in his video. He notes that XRP’s previously traded price level of $0.62 has become particularly attractive to institutional and corporate investors.
Whale transactions involving substantial quantities of XRP have increased significantly, indicating heightened interest from large-scale investors. This trend aligns with a broader global crypto market cap increase, suggesting ample liquidity for significant investments.
Armstrong also touches upon the strategic aspect of XRP’s price following Ripple’s legal victory over the SEC. He posits that a post-verdict price surge might have limited the token’s accessibility to a broader audience.
However, the current steadier price range, a retrace of the previously seen $0.72, allows for a more extensive accumulation of XRP, potentially setting the stage for a bigger bull run.
XRP Latest Price Action
XRP’s market performance has recently shown a notable decline, with its price falling by over 10% in the past two weeks. At the time of writing, XRP is trading at approximately $0.605, reflecting a 2.3% decrease in the past 24 hours.
Despite a significant bullish trend earlier this year, where it surged by 70.3% year to date, XRP remains substantially lower, down by 82.20%, from its all-time high of $3.40 in 2018.
This downward trend extends beyond just XRP’s price. The past two weeks have also decreased the asset’s daily trading volume, descending from highs of around $2.5 billion early last week to roughly $1.1 billion in the past 24 hours.
This decline in trading volume may signal a decrease in investor interest or market activity surrounding the asset, contributing to its reduced price.
Moreover, the broader crypto market has seen a mix of volatility and bearish trends, which might influence XRP’s performance. So far, Bitcoin has also declined by 2% in the past 24 hours, resulting in the drawdown of the global crypto market cap of 1.3% over the same period.
Featured image from Unsplash, Chart from TradingView


