Solana bulls buck the trend, price climbs by double digits

- SOL has rallied by double digits in the last 24 hours.
- Readings from the coin’s daily chart suggest a strong bull presence.
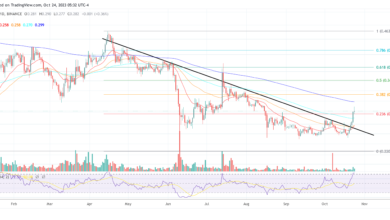
While most other altcoins are trading in the red, Solana [SOL] has defied the trend, surging by 10% in the last 24 hours.
How much are 1, 10, or 100 SOL worth today?
The Layer 1 (L1) coin traded at $26.38 at press time. In the last 24 hours, the altcoin’s trading volume has surged significantly by over 100%. With a trading volume of $813.85 million at press time, SOL’s trading volume has climbed to its highest in 90 days, data from Santiment showed.

Source: Santiment
Solana bulls are making it rain
The coin’s key indicators observed on a daily chart confirmed the bullish momentum in the current market.
The Elder-Ray Indicator – which measures the strength of competing groups of bulls and bears – was in an uptrend as of this writing.
Typically, when the slope that represents the indicator rises, it signals the presence of bullish sentiment in the market.
Conversely, when this indicator trends downward, it indicates that market participants have become bearish. At press time, SOL’s Elder-Ray was 1.268, maintaining its uptrend.
The coin’s Vortex Indicator confirmed the uptrend and showed that the buy signal first presented itself on 17 October when the VI+ line (blue) crossed from below the VI- (red) to be the top trendline. At press time, the VI+ line was 1.1159, while the VI- line was 0.8462, still in a downtrend.
Moreover, the alt’s Parabolic Stop and Reverse (SAR) indicator – which identifies potential reversal points in an asset’s price direction – showed that buying activity outpaced sell-offs among daily traders.
When the dots that make up the indicator are positioned above the price, it indicates a downtrend. Conversely, when these dots are below the price, it indicates a bullish trend.
The tightly packed dots rested below SOL’s price at press time. When these dots are closely packed together in this manner, it suggests that the trend is strong.
Is your portfolio green? Check the SOL Profit Calculator
Additionally, SOL’s key momentum indicators were above their respective center lines as of this writing, lending further credence to the current bullish cycle.
In fact, SOL’s Relative Strength Index (RSI) breached the 70 marks for the first time since the beginning of the month, suggesting that the altcoin was overbought. Likewise, the coin’s Money Flow Index (MFI) was 55.89.

Source: SOL/USDT on TradingView


