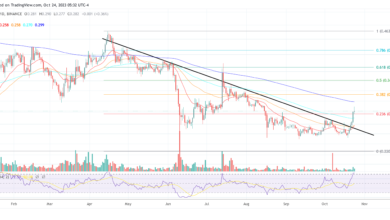
What to expect as ATOM weakens further

Disclaimer: The information presented does not constitute financial, investment, trading, or other types of advice and is solely the writer’s opinion.
- ATOM closed below the 38.2% Fib level ($8.5) on the daily chart.
- Open Interest surged as sellers took more open short positions.
Bitcoin [BTC] lost hold of the $29.5k range-low after a moderate July CPI data release on 10 August. The drop tipped bears to position for more gains, with most altcoins like Cosmos [ATOM] looking at likely losses over the weekend unless BTC reclaims $29.5k and aims at the mid-range of $30.4k.
How much are 1,10,100 ATOMs worth today?
In the meantime, ATOM printed a daily candlestick close below the crucial level of 38.2% Fib level ($8.5) on 10 August. It indicates increasing bear leverage, which could complicate matters for bulls.
Will ATOM flip 38.2% Fib level to resistance?

Source: ATOM/USDT on TradingView
The steady drop from mid-July $10 to $8 at press time exposed ATOM to shed over 15% of its value. But the bearish pressure seems far from over after bulls failed to stop the drop at the 38.2% Fib level ($8.5).
For perspective, the Fibonacci retracement tool (yellow) was plotted between June highs and June lows. Based on the tool, the 50% Fib level ($8.9) was crucial in June and July. However, it cracked in August, forcing the bulls to regroup at the next support – 38.2% Fib level ($8.5).
The 38.2% Fib level has shown weakness after the daily candlestick closed below it on 10 August. If sellers flip the level to resistance, ATOM could drop further to 23.6% Fib level ($7.9) – a foray into June lows.
The Chaikin Money Flow struggled to cross above zero, demonstrating muted capital inflows in the last few days. The retreating Relative Strength Index further confirmed the lack of demand and sellers’ conviction.
Open Interest rates surge

Source: Coinalyze
Is your portfolio green? Check out the ATOM Profit Calculator
Open Interest rates, which track the number of open contracts in the futures markets, surged from 10 August, rising from <$70 million to $73.5 million at the time of writing. However, price action dipped lower amidst rising Open Interest. The divergence points to sellers opening new positions to short the asset.
However, the CVD (Cumulative Volume Delta), which tracks whether buyers or sellers are in control, retreated slightly and moved sideways. It shows sellers have had little control over the last few days, but the side movement calls for caution.


