Breaking Through This Ceiling Will Propel XRP By Another 12%

The price of XRP experienced an increase after surpassing the $0.50 mark; however, it has recently undergone a fresh decline. Analyzing the daily chart, the altcoin has depreciated by approximately 3%, whereas the weekly chart shows an appreciation of about 6%.
The technical outlook for XRP indicates a bearish bias due to a decrease in demand and accumulation shown on the chart. Buying strength has weakened following the coin’s drop below the $0.50 threshold.
As Bitcoin entered the $30,000 price range, other major altcoins also began to appreciate on their respective charts but remained constrained beneath immediate resistance levels. So it is crucial for XRP to surpass the $0.50 mark to enable an upward movement.
Related Reading: Conflux Claims Its Place Among Top Altcoins As CFX Price Skyrockets 46%
Currently, the $0.50 price level acts as a significant barrier that needs to be converted into immediate support. If the altcoin manages to consistently trade above $0.50 for a substantial number of sessions, it may initiate a rally.
The market capitalization of XRP has also declined, indicating a decrease in buying strength.
XRP Price Analysis: One-Day Chart

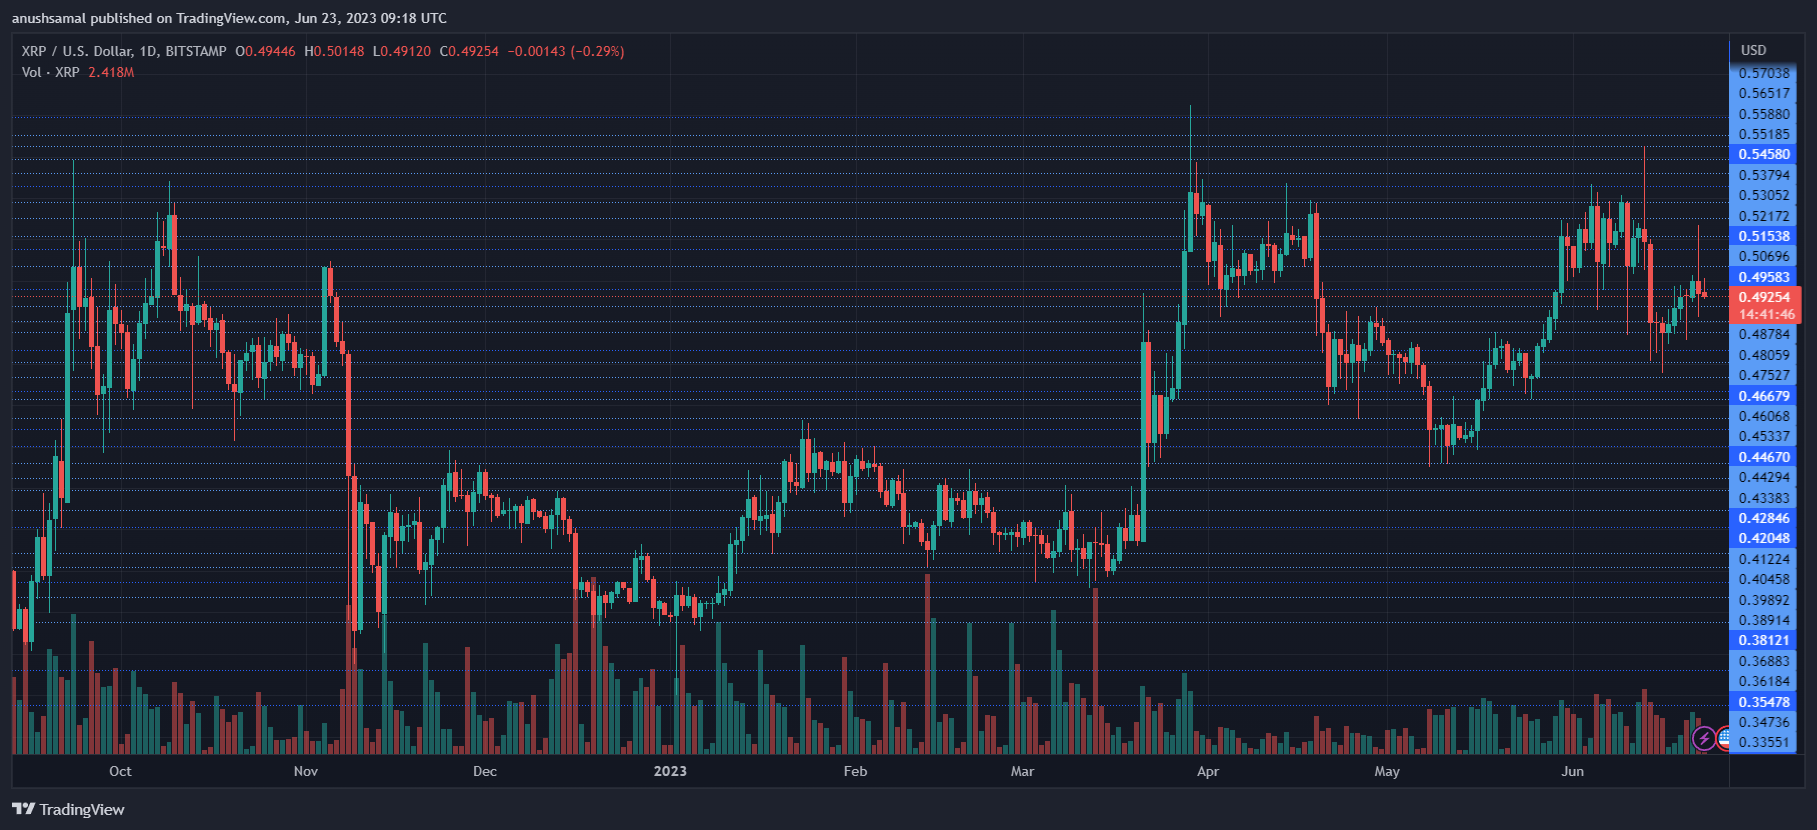
Following its failure to maintain a price above $0.50, the altcoin was trading at $0.49. With a small boost from buyers, there is potential for the altcoin to once again surpass the $0.50 threshold.
An important resistance level for XRP is situated at $0.53. If this resistance is overcome, XRP could make an attempt to trade above $0.56, resulting in a significant 12% rally.
Conversely, a decline from the current price level would bring XRP down to $0.47. The volume of XRP traded during the last session was in the red, indicating that selling pressure outweighed buying pressure.
Technical Analysis

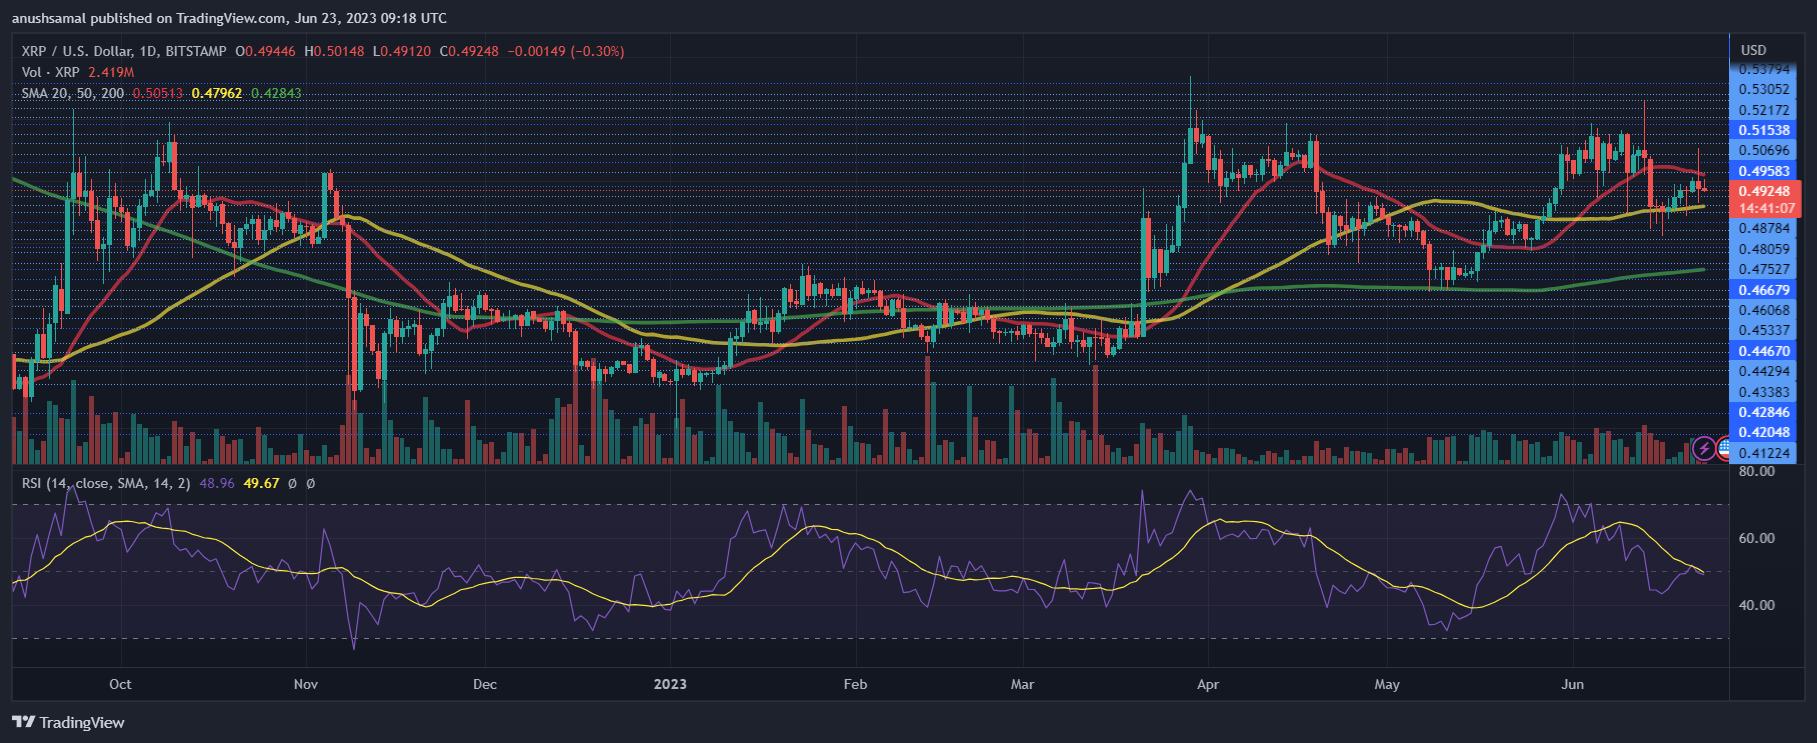
Despite a slight recovery attempt in buying strength, investor confidence was dampened by the recent price dip. The Relative Strength Index (RSI) was positioned just below the half-line, suggesting that sellers outnumbered buyers at the time of writing.
Additionally, the price of the asset dropped below the 20-Simple Moving Average line, indicating a decline in demand and signaling that sellers were driving the price momentum in the market.

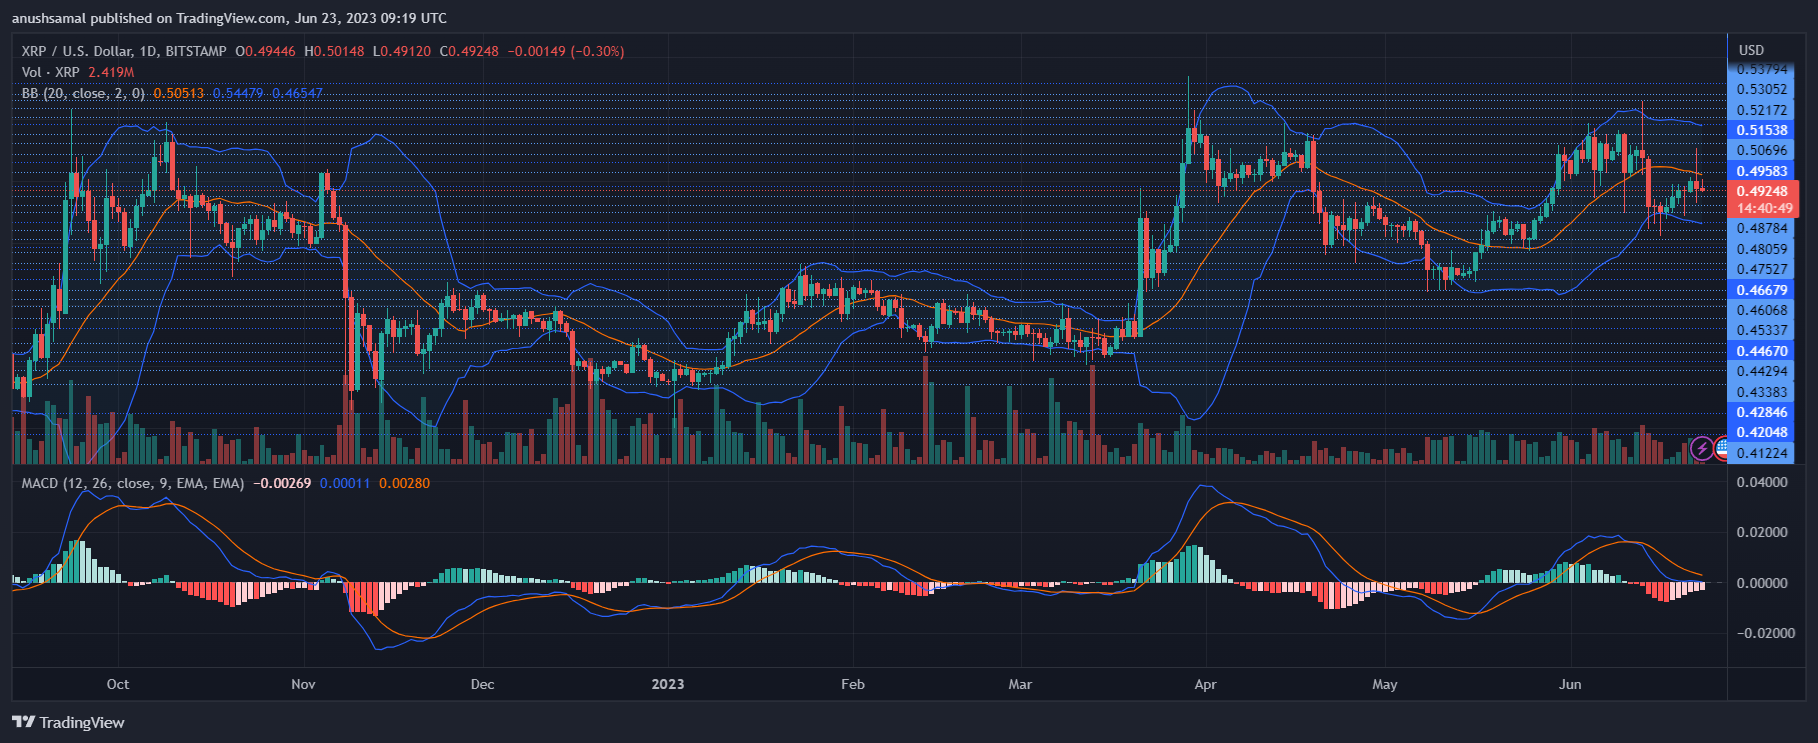
Despite a decline in sell signals on the daily chart though, XRP remained under the control of sellers. The Moving Average Convergence Divergence (MACD), which illustrates price momentum and its changes, displayed red signal bars associated with sell signals.
The Bollinger Bands, which indicate the price volatility and fluctuations, were wide but parallel, suggesting that XRP may not trade within a narrow range.
Given this, it will still face significant challenges in surpassing the $0.51 price level. However, a move above this level is anticipated to reignite demand, potentially propelling the price higher.
Featured Image From UnSplash, Chart From TradingView.com


