Disclaimer: The information presented does not constitute financial, investment, trading, or other types of advice and is solely the writer’s opinion.
- SOL’s 4-hour timeframe was bearish at the time of writing.
- The token’s buying volumes declined at the range-high of $16.11.
Solana [SOL] has been constricted in a range formation since 10 June. The corrective bounce from the $14.4 range low from 16 June received a double boost. The initial boost was from Bitcoin’s [BTC] upswing and, second, Solana’s impressive NFT performance.
Is your portfolio green? Check out the SOL Profit Calculator
But the price action has hit the range-high of $16.11 at the time of writing. On the other hand, BTC focused on $27k, but if bulls falter, SOL could retrace to these levels.
Can bulls clear the range-high hurdle?

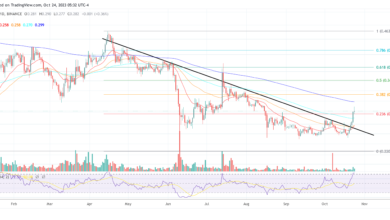
Source: SOL/USDT on TradingView
The RSI (Relative Strength Index) was above the 50-mark at press time but registered a downtick. It showed recent buying pressure eased after SOL hit the range-high of $16.11. Similarly, the Accumulation/Distribution retraced slightly, showing a pause in accumulation.
If BTC cannot cross $27k, SOL could retrace to the mid-range of $15.24 or range low of $14.4. Notably, the mid-range had rescued the bulls once before. Below lies a key resistance level of November/December 2022, at $14.93.
So, a likely rebound from the $14.93 – $15.24 could offer a new buying opportunity. Alternatively, a retest on the breakout level at the range-high of $16.11, especially if BTC crosses $27k, could offer secondary buying opportunities, targeting $17.33 (near the March swing low).
Buying volumes eased

Source: Coinalyze
How much are 1,10,100 SOLs worth today?
The CVD (Cumulative Volume Delta), which tracks buying and selling volumes and overall sentiment, improved on the 1-hour chart from 18 June. But the metric moved sideways at press time, indicating buying pressure eased.
Similarly, the open interest (OI) rates fluctuated narrowly below $160 million. A decline in the OI will indicate increasing bearish sentiment and likely retest of the mid-range level of $14.93 – $15.24. But a bullish BTC (above $27k) will invalidate the thesis.