Stacks (STX) Stumbles As Bulls Fail To Remain Intact

On March 20, 2023, Stacks (STX) hit an all-time high of $1.30. But the price declined below the $1 mark on March 25 as the bears increased momentum. The asset has remained under the mark from March until May 5.
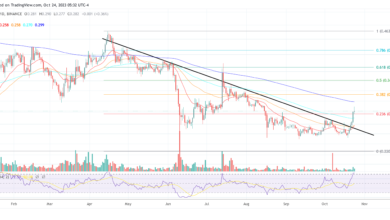
The 4-hour time frame chart today indicates that the STX token is trading on a downtrend movement due to high selling pressure. The token is also in a long-term downtrend, with the bears increasing its selling pressure forming lower highs and higher lows.
Will The Bulls Dethrone The Bears From The Market?
The overall structure of the STX market is bearish, with the bears battling with the bulls to take full control. The 4-hour chart shows that the STACK token is trading at $0.7276, with a decrease of -6.47% within the last 24 hours.
Related Reading: This Meme Coin Created By GPT-4 Is Now Worth $40 Million, Here’s Why
STX’s 24-hour trading volume is down by 56.76%, with a total market cap of $1 billion. This also shows that STX is not experiencing many activities at the moment.
Despite the increased selling momentum resulting from the investor’s sentiment, the bulls are attempting to regain control by taking advantage of the support level at $0.67.
Stacks (STX) Price Analysis
Currently, STX is trading within the range of the 200-day simple moving average and the 50-day simple moving average, suggesting a neutral market position or consolidation phase.
Consequently, traders and investors may use the 50-day and 200-day SMAs as reliable support and resistance levels while trading.
Notably, a breach above the 50-day SMA may signal a potential short-term uptrend, presenting a buying opportunity for traders. The fact that STX lacks an obvious trend, either upward or downward, suggests that the price is stable.
Currently, the RSI level of STX is 41, which shows that the STX market is heading towards the neutral zone, and there’s indecision. The Moving Average Convergence Divergence (MACD) line is below the signal line, which suggests a potential sell opportunity.
Moreover, the histogram, which measures the distance between the MACD line and the signal line, is below the zero line, indicating that the security is trading below its long-term trend.
Additionally, the histogram is increasing, implying that the bearish momentum is gaining strength. This situation suggests that STX is facing downward pressure, which could continue for some time, allowing traders to short the token.

STX trades between the $0.6666 and $0.8275 primary support and resistance levels. Stack’s first important resistance level is $0.8275. If the price rises above this level, the next significant resistance levels are $1.0212 and 1.3103.
Conversely, with high selling pressure, the price of STX may fall below its important support levels of $0.5220 & $0.2684.
Featured image from Pixabay and chart from Tradingview


