Aptos registers sustained rise in development activity, but here’s the issue

- Aptos’ development activity hit a 5-month high.
- The DEX volume on the layer-1 blockchain plunged by nearly 40% over the last week.
Aptos [APT] made an appreciable recovery since the USDC depegging episode, accumulating gains of over 27%, data from CoinMarketCap revealed.
While this behavior was exhibited by most coins in the crypto market, Aptos’ growing list of partnerships and product launches also had a significant part to play.
According to Santiment, the development activity on the chain hit a 5-month high. High development activity is indicative of the network’s commitment to upcoming launches and enhancements.

Source: Santiment
Read Aptos’ [APT] Price Prediction 2023-2024
New launches on the DeFi front
EZ Finance, a multi-chain leveraged farming protocol, announced its mainnet launch on the Aptos platform recently. The decentralized finance (DeFi) protocol, whose test version was launched in January this year, will automatically transition from testnet to mainnet on 27 March.
Just like other decentralized exchanges (DEXes), EZ finance users can borrow multiple assets supplied by lenders to the liquidity provider (LP) pools.
It also integrates with other DEXes like PancakeSwap [CAKE] to enable users to access the highest APY across Aptos and Sui ecosystems.
Mainnet launch is just around the corner!🚀
After months of hard work and dedication, we’re excited to bring our vision to life and deliver a seamless, secure, and scalable experience to our users🫡
Full Info: https://t.co/olcxD1OHOY#Aptos #Sui
— EZ Finance | IDO: March 20th 14:00 UTC (@EZProtocol) March 19, 2023
While the mainnet launch will definitely add another feather to Aptos’ cap, some of the key DeFi metrics sounded a red alarm.
The DEX volume on the layer-1 blockchain plunged, registering a weekly drop of nearly 40%, data from DeFiLlama revealed.
A big part of the decline could be attributed to AUX Exchange, whose trading volume dipped by 45% over the last week.

Source: DeFiLlama
Problems persist for APT
Since reaching an all-time high on 30 January, the network’s total value locked (TVL) went downhill. However, over the previous week, the TVL grew by 27%, recovering to some extent.

Source: DeFiLlama
Realistic or not, here’s APT’s market cap in BTC’s terms
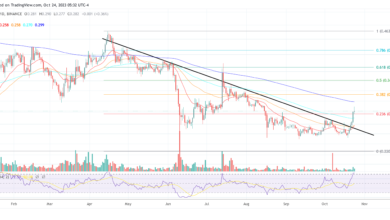
As mentioned earlier, APT’s price trajectory recovered from a declining phase and made significant gains over the past week.
The Moving Average Convergence Divergence (MACD) moved over the signal line. However, this was not enough to confirm a trend reversal as both were in negative territory.
The Relative Strength Index (RSI) was over neutral 50, indicating that selling pressure waned moderately. However, the On Balance Volume (OBV) gave a neutral signal.
Even so, the technical indicators gave an early indication of recovery. However, the momentum should be followed for some more days to get a better idea of APT’s price trajectory.

Source: Trading View APT/USD


